
Machine-translated page for increased accessibility for English questioners.
DŽEMUj - Conquest of knowledge from MU IS MU
Mária Briatková, Zdeněk Kedaj and Luboš PopelínskýLaboratory of Knowledge Mining, Faculty of Informatics, MU
DŽEMUj - Conquest of Knowledge from RBIs Waters
JEMu is a tool that facilitates rogue analysis using data mining [1] and visualization techniques [2]. The system was developed in the Knowledge Mining Laboratory with significant support from CVT FI MU and ÚVT MU and since the beginning of March it is in trial operation. Processing is bound to the selected ratchet at a given time. It is therefore possible to analyze one or more responders, for example, during the response, and then after completion.
Start data analysis
Teacher directly in IS MU by way of TEACHER - SUBJECT - REPLY MANAGER - RESPONSIBLE - "Analysis" enters the request for processing of the selected ratchet, see the following figure.
In the first step, IS MU generates a ratcheon in XML and then sends it to the external service for its own processing, ie outside of the IS MU itself. Upon completion of the analysis, which usually lasts less than a minute for an unloaded machine (550 students, 80 different questions), the results are available on the displayed line.
General data analysis and visualization
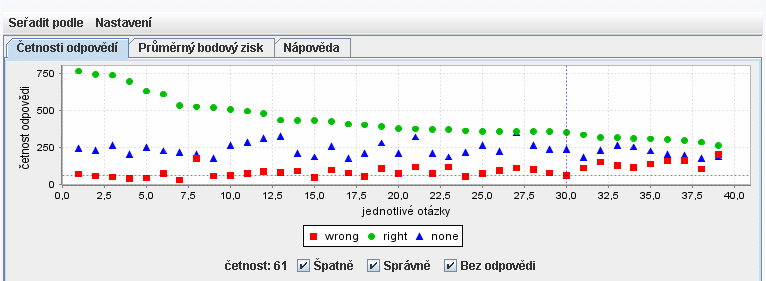
Routine results can be viewed in different views, sorted by number of successful, unsuccessful, or unanswered questions. Clicking on any of the points in the graph will display the question and basic statistics. Another option is to select (for example, mouse) part of a chart and visualize it.
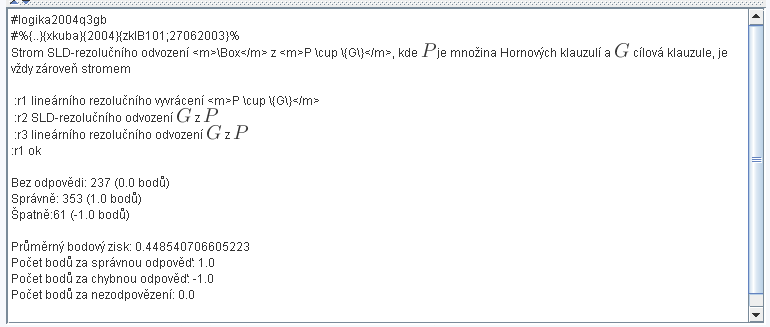 It is also possible to display the text of all questions that have a higher or lower success rate than the threshold specified.
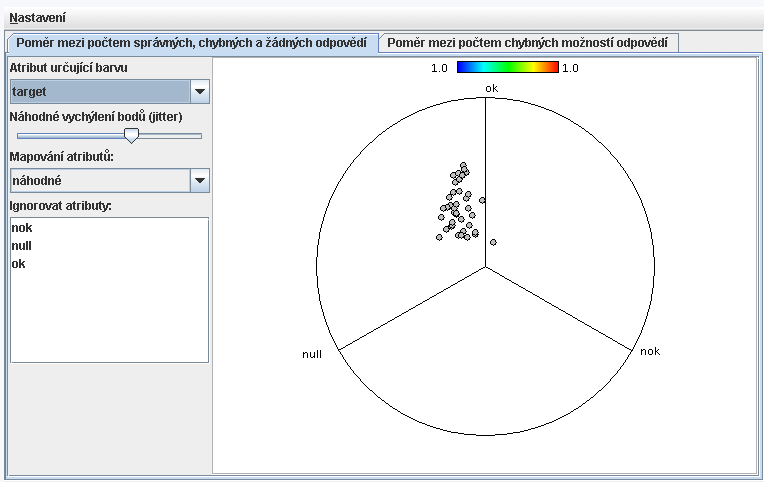
Layout according to correct, incorrect and missing answers
The second tool is to visualize clusters of questions. The RadViz method [4] is used to allow multidimensional data to be displayed in the plane. Individual attributes - in our case, the number of correct answers (ok), the erroneous answers (nokes) and the missing (null) are evenly distributed on the circle and the point (question) is attracted to each attribute according to the size of the attributes. Once again, it is possible to display the question text with just a click of the mouse.
IP address analysis
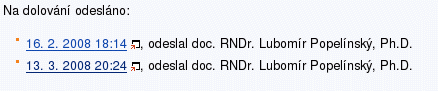
The teacher can display the number of sessions and the symbolic name of the address from which the students responded. You can also enter a request to display only those student names where the interval between results saved was less than the entered threshold. The resulting view (without names) is in the picture below. For each address, the number of segments and the symbolic name of this address are displayed.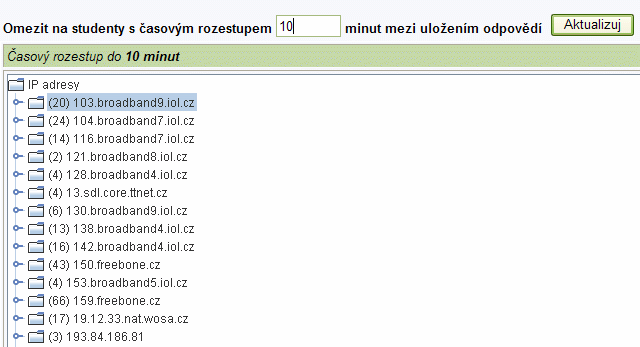
Frequent Patterns
Frequent patterns describe groups of question-response pairs that often occur in the rheum. The parameters are both the minimum occurrence of such a combination and the minimum length of the pattern. Lines contain all question-response pairs that occur in common patterns. Columns represent individual patterns. From the picture below, we see that, for example, the first and second answers are often found, and the third and fourth ones.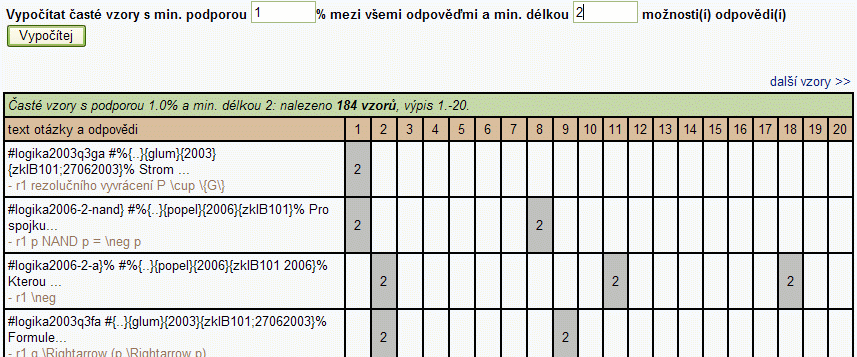
Thanks
The authors highly thank Michal Brandejs and his team for support, especially Matej Čuhel, Mirce Misáková and Lucce Pekárková, as well as Michal Procházka and Radim Pešovi, ÚVT MU for help with user authentication. Acknowledgments include Jan Blaták and Martin Večeř from FI MU's Knowledge Mining Laboratory.Reference
[1] Berka P. Knowledge mining from databases. Academia Praha 2003.[2] Murrell P. R Graphics. Chapman & Hall / CRC 2006
[3] Feldman R., Sanger J. The Text Mining Handbook. Cambridge University Press 2006
[4] Nováková L, Štěpánková O. Search for clusters using the visualization method RadViz. Proceedings of the Conference on Knowledge 2008, pp. 85-96, Bratislava 2008