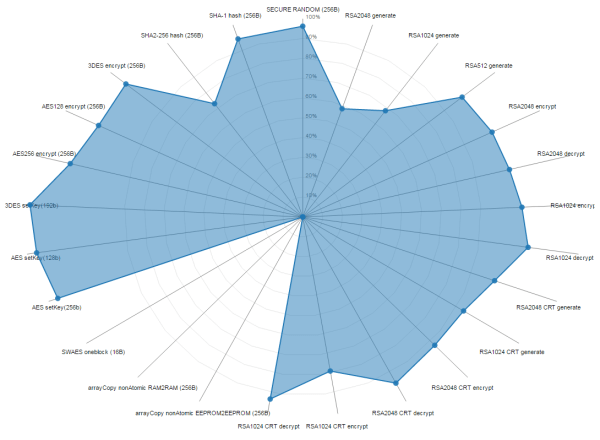
Performance radar graphs
Radar graph provides visual overview of Java Card performance.
It is composed of 25 frequently used functions (TOP FUNCTIONS).
The closest value to 100% represents the fastest result in particular method from all tested cards. Values closer to 10% supply slower results. 0% value means unsupported or not tested algorithms.
After hovering pointer above some point, the actual execution time of algorithm will be displayed.
We generate radar graphs for TOP FUNCTIONS only to preserve clarity of results.
You can find detailed test results in PERFORMANCE TESTING - EXECUTION TIME section.
List of tested Java Cards:
- Athena_IDProtect
- G+D Smartcafe 3.2 72K
- G+D Smartcafe 6.0 80K
- G+D Smartcafe Expert 4.x V2
- Gemplus GXP R4 72K
- JavaCOS A22 CR-ECC-SHA-2
- JavaCOS A22
- NXP J2D081 80K
- NXP J3A080
- J3H081 EMV
- NXP JCOP21 v2.4.2R3
- NXP JCOP31 v2.4.1 72K
- NXP JCOP41 v2.2.1 72K
- NXP JCOP 21 V2.2 36K
- NXP JCOP 31 V2.2 36K
- Oberthur ID-ONE Cosmo 64 RSA v5.4
- Softlock SLCOS InfineonSLE78
- Feitian JavaCOS 3.0.4 e2
- NXP 2.4.1 R3
- NXP CJ2A081
- NXP JCOP4 P71D321
- SECORA ID X
- Feitian JavaSD
- NXP J3H145 RSA4096
- NXP J3H145 RSA4096 enabled SCP03
- SECORA ID S (SCP02 with RSA2k JC305 GP230)
- Infineon SECORA ID X Batch 16072021 SALES
- Infineon SPA1-1 ThothTrust Edition
- JC30M48CR
- NXP JCOP3 J3H145g P60
- G+D SmartCafe 7.0 215K USB Token S
- Infineon CJTOP 80K INF SLJ 52GLA080AL M8.4
- JavaCOS A20
- JavaCOS A22 CR
- JavaCOS A40
- JavaCOS JC10M24R
- NXP J2A080 80K
- NXP J2E081
- NXP J3A081 JCOP v2.4.1
- NXP JCOP CJ2A081
- NXP JCOP4 J3R180 SECID P71
- Taisys SIMoME VAULT