Speeding-up Quantified Bit-Vector Solving Bit-Width Reductions and Extensions
Experimental evaluation
Table of Contents
1 CSV files
All statistics are computed from the BenchExec CSV file results.csv.
1.1 Convert to a correct CSV
First, we need to replace tabs by commas:
sed -i 's/\t/,/g' results.csv
And then we remove the standard BenchExec header rows and replace them by more readable ones.
cat results_header.csv > results_out.csv
tail -n +4 results.csv >> results_out.csv
1.2 Split into benchmark sets
We split benchmark name into family and name.
sed -i 's#/#,##' results_out.csv
#separator is #, so we do not have to escape all backslashes
sed -i 's/UltimateAutomizer/ua/g' results_out.csv
2 R environment
2.1 Load necessary libraries
library(dplyr)
library(ggplot2)
library(scales)
library(colorspace)
library(RColorBrewer)
library(xtable)
options("scipen"=100, "digits"=2)
2.2 Load all CSV files
res <- read.csv("results_out.csv", header=TRUE, stringsAsFactors=FALSE)
configurations = c('boolector', 'boolectorRed', 'boolectorRedNoPortfolio', 'cvc4', 'cvc4Red', 'q3b', 'q3bRed')
labels = c(boolector = 'Boolector', boolectorRed = 'Boolector+Red', boolectorRedNoPortfolio = 'Boolector+RedNoPortfolio', cvc4 = 'CVC4', cvc4Red = 'CVC4+Red', q3b = 'Q3B', q3bRed = 'Q3B+Red')
We need to modify all times for results other than sat or unsat to have the maximal values of walltime and CPU-time.
timeout <- 300

res[['trivial']] <- TRUE

for (c in configurations)
{
  res[[paste(c, 'solved', sep='.')]] <- res[[paste(c, 'result', sep='.')]] == "sat" | res[[paste(c, 'result', sep='.')]] == "unsat"
  res[[paste(c, 'cputime', sep='.')]][!res[[paste(c, 'solved', sep='.')]]] <- timeout
  res[[paste(c, 'walltime', sep='.')]][!res[[paste(c, 'solved', sep='.')]]] <- timeout
  res[['trivial']] <- res[['trivial']] & res[[paste(c, 'cputime', sep='.')]] < 0.1
}
2.3 Check correctness of results
We need to check that no two solvers disagreed on the status of a benchmark (i.e. sat vs unsat). The result of the following command should be empty!
res %>%
    mutate(sat = ((boolector.result == "sat") | (boolectorRed.result == "sat") | (boolectorRedNoPortfolio.result == "sat") | (cvc4.result == "sat") | (cvc4Red.result == "sat")  | (q3b.result == "sat") | (q3bRed.result == "sat")),
           unsat = ((boolector.result == "unsat") | (boolectorRed.result == "unsat") | (boolectorRedNoPortfolio.result == "unsat") | (cvc4.result == "unsat") | (cvc4Red.result == "unsat") | (q3b.result == "unsat") | (q3bRed.result == "unsat"))) %>%
    filter(sat & unsat) %>%
    select(benchmark, boolector.result, boolectorRed.result, cvc4.result, cvc4Red.result)
| benchmark | boolector.result | boolectorRed.result | cvc4.result | cvc4Red.result |
2.4 Compute virtual best Boolector|CVC4 and Boolector|Q3B
configurations = c('boolector', 'boolectorRed', 'boolectorRedNoPortfolio', 'cvc4', 'cvc4Red', 'boolectorCVC4', 'boolectorCVC4Red', 'q3b', 'q3bRed', 'boolectorQ3B', 'boolectorQ3BRed', 'boolectorCVC4Q3B', 'boolectorRedCVC4RedQ3BRed')
labels = c(boolector = 'Boolector', boolectorRed = 'Boolector+Red', boolectorRedNoPortfolio = 'Boolector+Red+Zero', cvc4 = 'CVC4', cvc4Red = 'CVC4+Red', boolectorCVC4 = 'Boolector|CVC4', boolectorCVC4Red = 'Boolector|CVC4Red', q3b = 'Q3B', q3bRed = 'Q3B+Red', boolectorQ3B = 'Boolector|Q3B', boolectorQ3BRed = 'Boolector|Q3BRed')
    res <- res %>% mutate(
      boolectorCVC4.solved = boolector.solved | cvc4.solved,
      boolectorCVC4.result = ifelse(boolector.solved, boolector.result, cvc4.result),
      boolectorCVC4.cputime = pmin(boolector.cputime, cvc4.cputime),
      boolectorCVC4.walltime = pmin(boolector.walltime, cvc4.walltime),
      boolectorCVC4.memusage = pmin(boolector.memusage, cvc4.memusage),
      boolectorCVC4Red.solved = boolector.solved | cvc4Red.solved,
      boolectorCVC4Red.result = ifelse(boolector.solved, boolector.result, cvc4Red.result),
      boolectorCVC4Red.cputime = pmin(boolector.cputime, cvc4Red.cputime),
      boolectorCVC4Red.walltime = pmin(boolector.walltime, cvc4Red.walltime),
      boolectorCVC4Red.memusage = pmin(boolector.memusage, cvc4Red.memusage),
      boolectorQ3B.solved = boolector.solved | q3b.solved,
      boolectorQ3B.result = ifelse(boolector.solved, boolector.result, q3b.result),
      boolectorQ3B.cputime = pmin(boolector.cputime, q3b.cputime),
      boolectorQ3B.walltime = pmin(boolector.walltime, q3b.walltime),
      boolectorQ3B.memusage = pmin(boolector.memusage, q3b.memusage),
      boolectorQ3BRed.solved = boolector.solved | q3bRed.solved,
      boolectorQ3BRed.result = ifelse(boolector.solved, boolector.result, q3bRed.result),
      boolectorQ3BRed.cputime = pmin(boolector.cputime, q3bRed.cputime),
      boolectorQ3BRed.walltime = pmin(boolector.walltime, q3bRed.walltime),
      boolectorQ3BRed.memusage = pmin(boolector.memusage, q3bRed.memusage),
      boolectorCVC4Q3B.solved = boolector.solved | cvc4.solved | q3b.solved,
      boolectorCVC4Q3B.result = ifelse(boolector.solved, boolector.result, ifelse(cvc4.solved, cvc4.result, q3b.result)),
      boolectorCVC4Q3B.cputime = pmin(boolector.cputime, cvc4.cputime, q3b.cputime),
      boolectorCVC4Q3B.walltime = pmin(boolector.walltime, cvc4.walltime, q3b.walltime),
      boolectorCVC4Q3B.memusage = pmin(boolector.memusage, cvc4.memusage, q3b.memusage),
      boolectorRedCVC4RedQ3BRed.solved = boolectorRed.solved | cvc4Red.solved | q3bRed.solved,
      boolectorRedCVC4RedQ3BRed.result = ifelse(boolectorRed.solved, boolectorRed.result, ifelse(cvc4Red.solved, cvc4Red.result, q3bRed.result)),
      boolectorRedCVC4RedQ3BRed.cputime = pmin(boolectorRed.cputime, cvc4Red.cputime, q3bRed.cputime),
      boolectorRedCVC4RedQ3BRed.walltime = pmin(boolectorRed.walltime, cvc4Red.walltime, q3bRed.walltime),
      boolectorRedCVC4RedQ3BRed.memusage = pmin(boolectorRed.memusage, cvc4Red.memusage, q3bRed.memusage)
)
3 Statistics
3.1 Numbers of solved formulas
3.1.1 Helper function to generate tables
getTable <- function()
{
  counts <- list()

  for (c in configurations)
  {
    counts[[c]] <- count_(res, paste(c, 'result', sep='.'))
    colnames(counts[[c]]) <- c('result', c)
  }

  return(Reduce(function(...) merge(..., all=TRUE), counts))
}
3.1.2 Table
getTable()
| result | boolector | boolectorRed | boolectorRedNoPortfolio | cvc4 | cvc4Red | boolectorCVC4 | boolectorCVC4Red | q3b | q3bRed | boolectorQ3B | boolectorQ3BRed | boolectorCVC4Q3B | boolectorRedCVC4RedQ3BRed |
|---|---|---|---|---|---|---|---|---|---|---|---|---|---|
| sat | 590 | 600 | 522 | 541 | 556 | 606 | 608 | 589 | 599 | 626 | 629 | 627 | 631 |
| TIMEOUT (timeout) | 278 | 256 | 636 | 237 | 192 | 117 | 113 | 165 | 135 | 80 | 73 | 71 | 65 |
| unknown | nil | nil | 13 | nil | nil | nil | nil | nil | nil | nil | nil | nil | nil |
| unsat | 4873 | 4885 | 4570 | 4963 | 4993 | 5018 | 5020 | 4987 | 5007 | 5035 | 5039 | 5043 | 5045 |
3.2 Solved formulas in benchmark families
table <- res %>%
  group_by(family) %>%
  summarise(total = n(),
            boolector = sum(boolector.solved),
            boolectorRed = sum(boolectorRed.solved),
            boolectorRedNoPortfolio = sum(boolectorRedNoPortfolio.solved),
            cvc4 = sum(cvc4.solved),
            cvc4Red = sum(cvc4Red.solved),
            boolectorCVC4 = sum(boolectorCVC4.solved),
            boolectorCVC4Red = sum(boolectorCVC4Red.solved),
            q3b = sum(q3b.solved),
            q3bRed = sum(q3bRed.solved),
            boolectorQ3B = sum(boolectorQ3B.solved),
            boolectorQ3BRed = sum(boolectorQ3BRed.solved)
            )

table <- rbind(table, data.frame(family='Total',
  total = sum(table$total),
  boolector = sum(table$boolector),
  boolectorRed = sum(table$boolectorRed),
  boolectorRedNoPortfolio = sum(table$boolectorRedNoPortfolio),
  cvc4 = sum(table$cvc4),
  cvc4Red = sum(table$cvc4Red),
  boolectorCVC4 = sum(table$boolectorCVC4),
  boolectorCVC4Red = sum(table$boolectorCVC4Red),
  q3b = sum(table$q3b),
  q3bRed = sum(table$q3bRed),
  boolectorQ3B = sum(table$boolectorQ3B),
  boolectorQ3BRed = sum(table$boolectorQ3BRed)))
table
| family | total | boolector | boolectorRed | boolectorRedNoPortfolio | cvc4 | cvc4Red | boolectorCVC4 | boolectorCVC4Red | q3b | q3bRed | boolectorQ3B | boolectorQ3BRed |
|---|---|---|---|---|---|---|---|---|---|---|---|---|
| 2017-Preiner-keymaera | 4035 | 4019 | 4022 | 4020 | 3996 | 4004 | 4025 | 4027 | 4009 | 4020 | 4025 | 4028 |
| 2017-Preiner-psyco | 194 | 193 | 193 | 129 | 190 | 190 | 193 | 193 | 165 | 168 | 193 | 193 |
| 2017-Preiner-scholl-smt08 | 374 | 299 | 304 | 224 | 244 | 260 | 306 | 306 | 315 | 318 | 327 | 328 |
| 2017-Preiner-tptp | 73 | 70 | 73 | 69 | 73 | 73 | 73 | 73 | 73 | 73 | 73 | 73 |
| 2017-Preiner-ua | 153 | 153 | 153 | 23 | 151 | 151 | 153 | 153 | 153 | 153 | 153 | 153 |
| 20170501-Heizmann-ua | 131 | 28 | 30 | 25 | 125 | 130 | 130 | 130 | 124 | 127 | 128 | 129 |
| 2018-Preiner-cav18 | 600 | 549 | 554 | 477 | 563 | 575 | 577 | 577 | 565 | 573 | 590 | 590 |
| wintersteiger | 181 | 152 | 156 | 125 | 162 | 166 | 167 | 169 | 172 | 174 | 172 | 174 |
| Total | 5741 | 5463 | 5485 | 5092 | 5504 | 5549 | 5624 | 5628 | 5576 | 5606 | 5661 | 5668 |
boolectorTable = table %>% select(family, total, boolector, boolectorRed, boolectorRedNoPortfolio, boolectorCVC4, boolectorCVC4Red, boolectorQ3B, boolectorQ3BRed)
colnames(boolectorTable) <- c("Family", "Total", "\\texttt{btor}", "\\texttt{btor-r}", "\\texttt{btor-r-no}", "\\texttt{btor|cvc4}", "\\texttt{btor|cvc4-r}", "\\texttt{btor|q3b}", "\\texttt{btor|q3b-r}")
print(xtable(boolectorTable,
  type = "latex",
  label = "tbl:solvedBoolector",
  caption = "The table shows for each benchmark family and each solver the number of benchmarks that were solver by the solver within a given timeout."),
  file = "solvedBoolector.tex",
  sanitize.colnames.function = function(x) x, rotate.colnames=TRUE, include.rownames=FALSE, booktabs=TRUE, hline.after = c(-1, 0, nrow(table)-1, nrow(table)))
otherTable = table %>% select(family, total, boolectorCVC4, boolectorCVC4Red, boolectorQ3B, boolectorQ3BRed)
colnames(otherTable) <- c("Family", "Total", "\\texttt{btor|cvc4}", "\\texttt{btor|cvc4-r}", "\\texttt{btor|q3b}", "\\texttt{btor|q3b-r}")
print(xtable(otherTable,
  type = "latex",
  label = "tbl:solvedOther",
  caption = "The table shows for each benchmark family and each solver the number of benchmarks that were solver by the solver within a given timeout."),
  file = "solvedOther.tex",
  sanitize.colnames.function = function(x) x, include.rownames=FALSE, booktabs=TRUE, hline.after = c(-1, 0, nrow(table)-1, nrow(table)))
3.3 Cross comparison
3.3.1 Helper function to generate tables
First we need a function which for given configurations computes a number of benchmarks that the first configuration has solved, but the second one has not.
firstIsBetter <- function(c1, c2)
  {
    c1Solved <- res[[paste(c1, 'solved', sep='.')]]
    c2Solved <- res[[paste(c2, 'solved', sep='.')]]

    onlyC1Solved <- c1Solved & !(c2Solved)
    return(onlyC1Solved)
  }

  formulasFirstIsBetter <- function(c1, c2)
  {
    return(res$benchmark[firstIsBetter(c1, c2)])
  }

  compareConfigurations <- function(c1, c2)
  {
    return(sum(firstIsBetter(c1, c2)))
  }
We can use this function to generate the cross table.
crossTable <- function()
{
  results <- c()
  for (c1 in configurations)
  {
    for (c2 in configurations)
    {
      results <- c(results, compareConfigurations(c1, c2))
    }
  }

  results.table <- matrix(results, ncol=13,byrow=TRUE)
  colnames(results.table) <- configurations
  rownames(results.table) <- configurations
  out <- as.table(results.table)
  return(out)
}
3.3.2 Table
crossTable()
| boolector | boolectorRed | boolectorRedNoPortfolio | cvc4 | cvc4Red | boolectorCVC4 | boolectorCVC4Red | q3b | q3bRed | boolectorQ3B | boolectorQ3BRed | boolectorCVC4Q3B | boolectorRedCVC4RedQ3BRed | |
|---|---|---|---|---|---|---|---|---|---|---|---|---|---|
| boolector | 0 | 0 | 393 | 120 | 79 | 0 | 0 | 85 | 62 | 0 | 0 | 0 | 0 |
| boolectorRed | 22 | 0 | 393 | 129 | 84 | 9 | 5 | 93 | 63 | 8 | 1 | 6 | 0 |
| boolectorRedNoPortfolio | 22 | 0 | 0 | 92 | 48 | 9 | 5 | 65 | 35 | 8 | 1 | 6 | 0 |
| cvc4 | 161 | 148 | 504 | 0 | 0 | 0 | 0 | 75 | 57 | 9 | 7 | 0 | 0 |
| cvc4Red | 165 | 148 | 505 | 45 | 0 | 4 | 0 | 85 | 57 | 13 | 7 | 4 | 0 |
| boolectorCVC4 | 161 | 148 | 541 | 120 | 79 | 0 | 0 | 94 | 69 | 9 | 7 | 0 | 0 |
| boolectorCVC4Red | 165 | 148 | 541 | 124 | 79 | 4 | 0 | 98 | 69 | 13 | 7 | 4 | 0 |
| q3b | 198 | 184 | 549 | 147 | 112 | 46 | 46 | 0 | 0 | 0 | 0 | 0 | 0 |
| q3bRed | 205 | 184 | 549 | 159 | 114 | 51 | 47 | 30 | 0 | 7 | 0 | 5 | 0 |
| boolectorQ3B | 198 | 184 | 577 | 166 | 125 | 46 | 46 | 85 | 62 | 0 | 0 | 0 | 0 |
| boolectorQ3BRed | 205 | 184 | 577 | 171 | 126 | 51 | 47 | 92 | 62 | 7 | 0 | 5 | 0 |
| boolectorCVC4Q3B | 207 | 191 | 584 | 166 | 125 | 46 | 46 | 94 | 69 | 9 | 7 | 0 | 0 |
| boolectorRedCVC4RedQ3BRed | 213 | 191 | 584 | 172 | 127 | 52 | 48 | 100 | 70 | 15 | 8 | 6 | 0 |
3.4 Times
table <- res %>%
  group_by(family) %>%
  summarise(boolector = round(sum(boolector.walltime)),
            boolectorRed = round(sum(boolectorRed.walltime)),
            cvc4 = round(sum(cvc4.walltime)),
            cvc4Red = round(sum(cvc4Red.walltime)),
            boolectorCVC4 = round(sum(boolectorCVC4.walltime)),
            boolectorCVC4Red = round(sum(boolectorCVC4Red.walltime)),
            q3b = round(sum(q3b.walltime)),
            q3bRed = round(sum(q3bRed.walltime)),
            boolectorQ3B = round(sum(boolectorQ3B.walltime)),
            boolectorQ3BRed = round(sum(boolectorQ3BRed.walltime))
            )

table <- rbind(table, data.frame(family='Total',
  boolector = sum(table$boolector),
  boolectorRed = sum(table$boolectorRed),
  cvc4 = sum(table$cvc4),
  cvc4Red = sum(table$cvc4Red),
  boolectorCVC4 = sum(table$boolectorCVC4),
  boolectorCVC4Red = sum(table$boolectorCVC4Red),
  q3b = sum(table$q3b),
  q3bRed = sum(table$q3bRed),
  boolectorQ3B = sum(table$boolectorQ3B),
  boolectorQ3BRed = sum(table$boolectorQ3BRed)))
table
| family | boolector | boolectorRed | cvc4 | cvc4Red | boolectorCVC4 | boolectorCVC4Red | q3b | q3bRed | boolectorQ3B | boolectorQ3BRed |
|---|---|---|---|---|---|---|---|---|---|---|
| 2017-Preiner-keymaera | 10897 | 7876 | 12709 | 10393 | 5362 | 4372 | 8568 | 5365 | 3395 | 2463 |
| 2017-Preiner-psyco | 1613 | 1474 | 2237 | 2135 | 841 | 839 | 9425 | 8754 | 1072 | 1063 |
| 2017-Preiner-scholl-smt08 | 26843 | 25295 | 41609 | 36739 | 23900 | 23879 | 20095 | 19528 | 16639 | 16460 |
| 2017-Preiner-tptp | 904 | 9 | 3 | 8 | 1 | 2 | 2 | 7 | 1 | 2 |
| 2017-Preiner-ua | 331 | 341 | 683 | 697 | 298 | 299 | 11 | 22 | 7 | 13 |
| 20170501-Heizmann-ua | 30934 | 30332 | 2415 | 819 | 624 | 646 | 2278 | 1340 | 1007 | 715 |
| 2018-Preiner-cav18 | 17677 | 15592 | 12450 | 8968 | 7832 | 7791 | 11018 | 8612 | 3257 | 3274 |
| wintersteiger | 9178 | 7690 | 5839 | 4645 | 4494 | 3761 | 4003 | 2779 | 3201 | 2429 |
| Total | 98377 | 88609 | 77945 | 64404 | 43352 | 41589 | 55400 | 46407 | 28579 | 26419 |
print(xtable(tableWall, type = "latex",
caption = "The table shows for each benchmark family and both of the solvers the sum of wall times of benchmarks that were solved by both of the solvers."),
file = "times_wall.tex", include.rownames=FALSE, booktabs=TRUE, hline.after = c(-1, 0, nrow(tableWall)-1, nrow(tableWall)))
4 Plots
4.1 Scatter plots
4.1.1 Helper functions
We again define a function, which can generate a scatter plot for a given benchmark set and two configurations.
scatterPlotResult <- function(c1, c2, time = 'cputime', c1lab=c1, c2lab=c2)
{
return (ggplot(res,
      aes(res[[paste(c1, time, sep='.')]], res[[paste(c2, time, sep='.')]], shape=if_else(boolectorRedNoPortfolio.solved, boolectorRedNoPortfolio.result, boolectorCVC4Red.result), colour=family), xlim=c(0.001,timeout), ylim=c(0.001,timeout)) +
      geom_point() +
      scale_shape_manual(values=c(4, 5, 6)) +
      geom_abline(intercept=0) +
      geom_abline(intercept=1, color='gray') +
      geom_abline(intercept=-1, color='gray') +
      geom_abline(intercept=2, color='gray') +
      geom_abline(intercept=-2, color='gray') +
      labs(title = "", x = c1lab, y = c2lab, color = "Family", shape = "Result") +
      scale_x_log10(limits = c(0.005, 1.1*timeout),
      breaks=c(0.001,0.01,0.1,1,10,100,timeout),
      minor_breaks=c(0.001,0.01,0.1,1,10,100),
      labels=c("0.001", "0.01", "0.1", "1", "10", "100", "T/O")) +
      scale_y_log10(limits = c(0.005, 1.1*timeout),
      breaks=c(0.001,0.01,0.1,1,10,100,timeout),
      minor_breaks=c(0.001,0.01,0.1,1,10,100),
      labels=c("0.001", "0.01", "0.1", "1", "10", "100", "T/O")))
}

scatterPlotMem <- function(c1, c2)
{
return (ggplot(res,
      aes(res[[paste(c1, 'memusage', sep='.')]], res[[paste(c2, 'memusage', sep='.')]], colour=factor(boolectorCVC4Red.result, c("timeout", "sat", "unsat", "out of memory"))), xlim=c(0.001,8000000000), ylim=c(0.01,8000000000)) +
      geom_point() +
      geom_abline(intercept=0) +
      xlab(c1) +
      ylab(c2) +
      scale_x_log10(limits = c(1000000, 16000000000), breaks = trans_breaks("log10", function(x) 10^x), labels = trans_format("log10", math_format(10^.x))) +
      scale_y_log10(limits = c(1000000, 16000000000), breaks = trans_breaks("log10", function(x) 10^x), labels = trans_format("log10", math_format(10^.x))) +
      guides(colour=FALSE))
}
4.1.2 Wall Time
scatterPlotResult('boolector', 'boolectorRed', 'walltime', 'btor time (s)', 'btor-r time (s)')
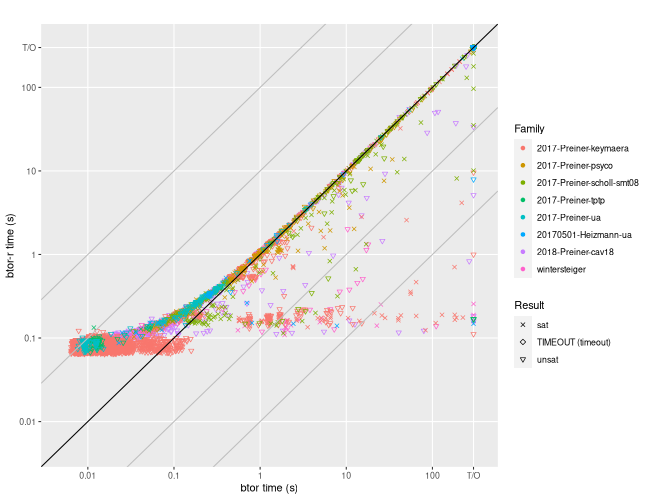
scatterPlotResult('boolector', 'boolectorRed', 'walltime', 'btor time (s)', 'btor-r time (s)')
scatterPlotResult('boolector', 'boolectorRedNoPortfolio', 'walltime', 'btor time (s)', 'btor-r-no time (s)')
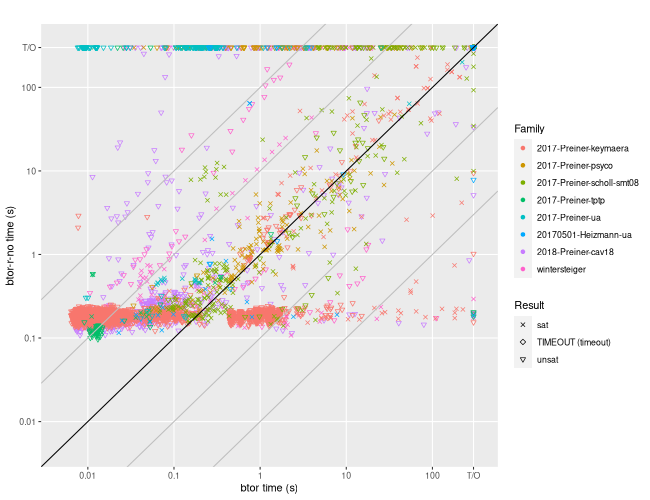
This is the PDF used in the paper, it shares the legend with another plot.
scatterPlotResult('boolector', 'boolectorRedNoPortfolio', 'walltime', 'btor time (s)', 'btor-r-no time (s)') + theme(legend.position = "none")
boolectorNoPortfolioScatter.pdf
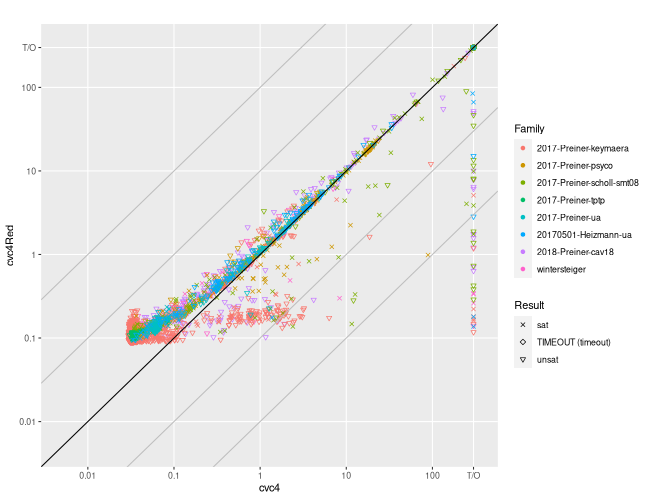
scatterPlotResult('cvc4', 'cvc4Red', 'walltime')
scatterPlotResult('boolectorCVC4', 'boolectorCVC4Red', 'walltime', 'btor|cvc4 time (s)', 'btor|cvc4-r time (s)')
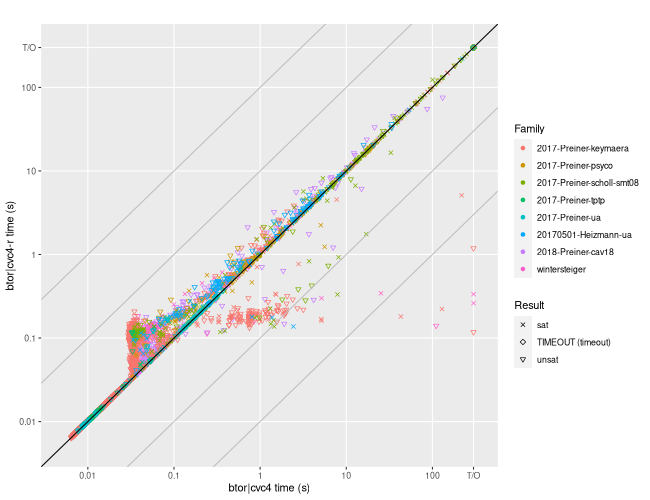
This is the PDF used in the paper, it shares the legend with another plot.
scatterPlotResult('boolectorCVC4', 'boolectorCVC4Red', 'walltime', 'btor|cvc4 time (s)', 'btor|cvc4-r time (s)') + theme(legend.position = "none")
scatterPlotResult('boolectorQ3B', 'boolectorQ3BRed', 'walltime', 'btor|q3b time (s)', 'btor|q3b-r time (s)')
scatterPlotResult('boolectorQ3B', 'boolectorQ3BRed', 'walltime', 'btor|q3b time (s)', 'btor|q3b-r time (s)')
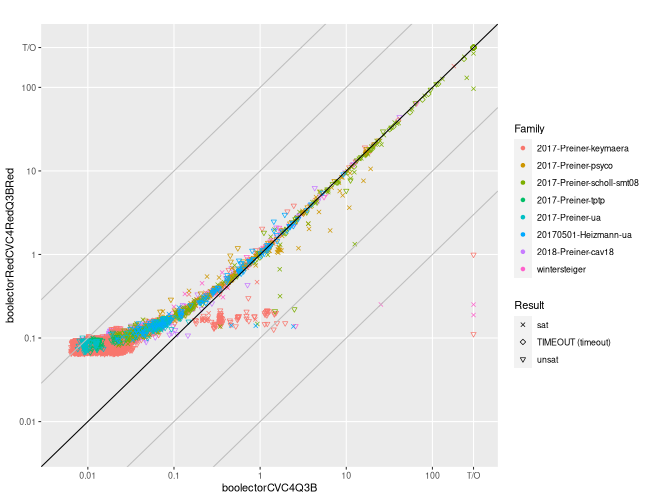
scatterPlotResult('boolectorCVC4Q3B', 'boolectorRedCVC4RedQ3BRed', 'walltime')
5 Bit-widths
Unzip the results
cd bitwidths
unzip benchmark-formulaReducer-all.2020-05-11_1443.logfiles.zip
Remove all results that were decided by the precise solver.
grep -rl "Child Process 0" bitwidths | xargs rm
Extract the bit-widths and check the number of results.
for f in bitwidths/benchmark-formulaReducer-all.2020-05-11_1443.logfiles/* ; do grep "reduced to" $f | tail -1 | cut -d' ' -f6; done > bitwidths/bitwidths.log
wc -l bitwidths/bitwidths.log
475 bitwidths/bitwidths.log
Display the distribution of the bit-widths.
df <- read.table("bitwidths/bitwidths.log", header = FALSE)
names(df) <- 'bitwidth'
t(count(df, bitwidth))
| bitwidth | 1 | 2 | 4 | 8 | 16 |
| n | 193 | 141 | 111 | 23 | 7 |