Comparison of Q3B and other SMT solvers
Table of Contents
1 Tools
In the evaluation, we used the following tools
1.1 Boolector
- in the version 3.0.0
- using no additional arguments
1.2 CVC4
- in the version 1.6
using the following arguments
--no-cond-rewrite-quant --cbqi-bv-ineq=eq-boundary --global-negate --no-cbqi-innermost --ext-rew-prep
1.3 Z3
- in the stable version 4.8.3
- using no additional arguments
1.4 Q3B
- GitHub release https://github.com/martinjonas/Q3B/releases/tag/v1.0
- using no additional arguments
2 CSV files
All statistics are computed from the BenchExec CSV file results.csv.
2.1 Convert to a correct CSV
First, we need to replace tabs by commas:
sed -i 's/\t/,/g' results.csv
And then we remove the standard BenchExec header rows and replace them by more readable ones. The header is located in the file results_header.csv.
cat results_header.csv > results.out.csv
tail -n +4 results.csv >> results.out.csv
2.2 Split into benchmark sets
We split benchmark name into family and name.
sed -i 's#/#,##' results.out.csv
sed -i 's#20170501-Heizmann#heizmann#' results.out.csv
sed -i 's#UltimateAutomizer#ua#' results.out.csv
3 R environment
3.1 Load necessary libraries
library(dplyr)
library(ggplot2)
library(scales)
library(colorspace)
library(RColorBrewer)
library(xtable)
options("scipen"=100, "digits"=0)
3.2 Load all CSV files
res = list()
res <- read.csv("results.out.csv", header=TRUE, stringsAsFactors=FALSE)
configurations = c('boolector', 'cvc4', 'q3b', 'z3')
labels = c(boolector = 'Boolector', cvc4 = 'CVC4', q3b = 'Q3B', z3 = 'Z3')
We need to modify all times for results other than sat or unsat to have the maximal values of walltime and CPU-time.
timeout <- 1200

res[['trivial']] <- TRUE

for (c in configurations)
{
  res[[paste(c, 'solved', sep='.')]] <- res[[paste(c, 'result', sep='.')]] == "sat" | res[[paste(c, 'result', sep='.')]] == "unsat"
  res[[paste(c, 'cputime', sep='.')]][!res[[paste(c, 'solved', sep='.')]]] <- timeout
  res[[paste(c, 'walltime', sep='.')]][!res[[paste(c, 'solved', sep='.')]]] <- timeout
  res[['trivial']] <- res[['trivial']] & res[[paste(c, 'cputime', sep='.')]] < 0.1
}
3.3 Check correctness of results
We need to check that no two solvers disagreed on the status of a benchmark (i.e. sat vs unsat). The result of the following command should be empty!
res %>%
    mutate(sat = ((boolector.result == "sat") | (cvc4.result == "sat") | (z3.result == "sat") |  (q3b.result == "sat")),
           unsat = ((boolector.result == "unsat") | (cvc4.result == "unsat") | (z3.result == "unsat") |  (q3b.result == "unsat"))) %>%
    filter(sat & unsat) %>%
    select(benchmark, boolector.result, cvc4.result, q3b.result, z3.result)
| benchmark | boolector.result | cvc4.result | q3b.result | z3.result |
4 Statistics
4.1 Numbers of solved formulas
4.1.1 Helper function to generate tables
getTable <- function()
{
  counts <- list()

  for (c in configurations)
  {
    counts[[c]] <- count_(res, paste(c, 'result', sep='.'))
    colnames(counts[[c]]) <- c('result', c)
  }

  return(Reduce(function(...) merge(..., all=TRUE), counts))
}
4.1.2 Total
getTable()
| result | boolector | cvc4 | q3b | z3 |
|---|---|---|---|---|
| OUT OF MEMORY | nil | nil | nil | 6 |
| sat | 606 | 555 | 617 | 563 |
| TIMEOUT (timeout) | 271 | 226 | 146 | 277 |
| unsat | 4874 | 4970 | 4988 | 4905 |
4.2 Solved formulas in benchmark families
table <- res %>%
    group_by(family) %>%
    summarise(total = sum(n()),
              boolector = sum(boolector.solved),
              cvc4 = sum(cvc4.solved),
              z3 = sum(z3.solved),
              q3b = sum(q3b.solved),
              maxSolved = max(boolector, cvc4, q3b, z3))

table <- rbind(table, data.frame(family='Total',
   total = sum(table$total),
   boolector = sum(table$boolector),
   cvc4 = sum(table$cvc4),
   z3 = sum(table$z3),
   q3b = sum(table$q3b),
   maxSolved = max(sum(table$boolector), sum(table$cvc4), sum(table$q3b), sum(table$z3))))

table %>% select(family, total, boolector, cvc4, q3b, z3)
| family | total | boolector | cvc4 | q3b | z3 |
|---|---|---|---|---|---|
| 2017-Preiner-keymaera | 4035 | 4019 | 3996 | 4009 | 4031 |
| 2017-Preiner-psyco | 194 | 193 | 190 | 182 | 194 |
| 2017-Preiner-scholl-smt08 | 374 | 306 | 248 | 317 | 272 |
| 2017-Preiner-tptp | 73 | 69 | 73 | 73 | 73 |
| 2017-Preiner-ua | 153 | 152 | 151 | 153 | 153 |
| 2018-Preiner-cav18 | 600 | 549 | 565 | 565 | 550 |
| heizmann-ua | 131 | 30 | 128 | 124 | 32 |
| wintersteiger | 191 | 162 | 174 | 182 | 163 |
| Total | 5751 | 5480 | 5525 | 5605 | 5468 |
4.2.1 Only sat
satTable <- res %>%
    filter(z3.result == 'sat' | boolector.result == 'sat' | cvc4.result == 'sat' | q3b.result == 'sat') %>%
    group_by(family) %>%
    summarise(total = sum(n()),
              result = '',
              boolector = sum(boolector.solved),
              cvc4 = sum(cvc4.solved),
              q3b = sum(q3b.solved),
              z3 = sum(z3.solved),
              maxSolved = max(sum(boolector.solved), sum(cvc4.solved), sum(q3b.solved)))

satTable <- rbind(satTable, data.frame(family='Total SAT',
   result = 'SAT',
   total = sum(satTable$total),
   boolector = sum(satTable$boolector),
   cvc4 = sum(satTable$cvc4),
   q3b = sum(satTable$q3b),
   z3 = sum(satTable$z3),
   maxSolved = max(sum(satTable$boolector), sum(satTable$cvc4), sum(satTable$q3b), sum(satTable$z3))))

satTable %>% select(result, family, total, boolector, cvc4, q3b, z3)
| result | family | total | boolector | cvc4 | q3b | z3 |
|---|---|---|---|---|---|---|
| 2017-Preiner-keymaera | 108 | 103 | 77 | 104 | 108 | |
| 2017-Preiner-psyco | 132 | 131 | 129 | 123 | 132 | |
| 2017-Preiner-scholl-smt08 | 256 | 244 | 214 | 247 | 204 | |
| 2017-Preiner-tptp | 17 | 16 | 17 | 17 | 17 | |
| 2017-Preiner-ua | 16 | 16 | 14 | 16 | 16 | |
| heizmann-ua | 21 | 19 | 19 | 20 | 15 | |
| wintersteiger | 91 | 77 | 85 | 90 | 71 | |
| SAT | Total SAT | 641 | 606 | 555 | 617 | 563 |
maxSatTable <- transmute(satTable,
  Result = result,
  Family = family,
  Total = total,
  Boolector = ifelse(boolector == maxSolved, sprintf("\\textbf{%d}", boolector), boolector),
  CVC4 = ifelse(cvc4 == maxSolved, sprintf("\\textbf{%d}", cvc4), cvc4),
  Q3B = ifelse(q3b == maxSolved, sprintf("\\textbf{%d}", q3b), q3b),
  Z3 = ifelse(z3 == maxSolved, sprintf("\\textbf{%d}", z3), z3)
  )
4.2.2 Only unsat
unsatTable <- res %>%
    filter(z3.result == 'unsat' | boolector.result == 'unsat' | cvc4.result == 'unsat' | q3b.result == 'unsat') %>%
    group_by(family) %>%
    summarise(total = sum(n()),
              result = '',
              boolector = sum(boolector.solved),
              cvc4 = sum(cvc4.solved),
              q3b = sum(q3b.solved),
              z3 = sum(z3.solved),
              maxSolved = max(boolector, cvc4, q3b, z3))

unsatTable <- rbind(unsatTable, data.frame(family='Total UNSAT',
   result = 'UNSAT',
   total = sum(unsatTable$total),
   boolector = sum(unsatTable$boolector),
   cvc4 = sum(unsatTable$cvc4),
   q3b = sum(unsatTable$q3b),
   z3 = sum(unsatTable$z3),
   maxSolved = max(sum(unsatTable$boolector), sum(unsatTable$cvc4), sum(unsatTable$q3b), sum(unsatTable$z3))))

unsatTable %>% select(result, family, total, boolector, cvc4, q3b, z3)
| result | family | total | boolector | cvc4 | q3b | z3 |
|---|---|---|---|---|---|---|
| 2017-Preiner-keymaera | 3925 | 3916 | 3919 | 3905 | 3923 | |
| 2017-Preiner-psyco | 62 | 62 | 61 | 59 | 62 | |
| 2017-Preiner-scholl-smt08 | 75 | 62 | 34 | 70 | 68 | |
| 2017-Preiner-tptp | 56 | 53 | 56 | 56 | 56 | |
| 2017-Preiner-ua | 137 | 136 | 137 | 137 | 137 | |
| 2018-Preiner-cav18 | 590 | 549 | 565 | 565 | 550 | |
| heizmann-ua | 110 | 11 | 109 | 104 | 17 | |
| wintersteiger | 94 | 85 | 89 | 92 | 92 | |
| UNSAT | Total UNSAT | 5049 | 4874 | 4970 | 4988 | 4905 |
maxUnsatTable <- transmute(unsatTable,
  Result = result,
  Family = family,
  Total = total,
  Boolector = ifelse(boolector == maxSolved, sprintf("\\textbf{%d}", boolector), boolector),
  CVC4 = ifelse(cvc4 == maxSolved, sprintf("\\textbf{%d}", cvc4), cvc4),
  Q3B = ifelse(q3b == maxSolved, sprintf("\\textbf{%d}", q3b), q3b),
  Z3 = ifelse(z3 == maxSolved, sprintf("\\textbf{%d}", z3), z3)
  )
4.2.3 Both
maxBothTable <- rbind(maxUnsatTable, maxSatTable)
maxBothTable <- rbind(maxBothTable, data.frame(Family='Total',
     Result = '',
     Total = sum(res %>% summarize(n())),
     Boolector = sum(res$boolector.solved),
     CVC4 = sum(res$cvc4.solved),
     Q3B = sprintf("\\textbf{%d}", sum(res$q3b.solved)),
     Z3 = sum(res$z3.solved)))

xt <- xtable(maxBothTable, type = "latex", label="tbl:solved",
             caption = "Numbers of benchmarks solved by the individual solvers divided by the satisfiability/unsatisfiability and the benchmark family.")
align(xt) <- c('l', 'l', 'l', 'r', 'r', 'r', 'r', 'r')
print(xt,
      file = "Tables/solved.tex", rotate.colnames=TRUE, include.rownames=FALSE, booktabs=TRUE, hline.after = c(-1, 0, 9, nrow(maxBothTable)-1, nrow(maxBothTable)), table.placement="tbp",
      sanitize.text.function=function(x) x)

maxBothTable
| Result | Family | Total | Boolector | CVC4 | Q3B | Z3 |
|---|---|---|---|---|---|---|
| 2017-Preiner-keymaera | 3925 | 3916 | 3919 | 3905 | \textbf{3923} | |
| 2017-Preiner-psyco | 62 | \textbf{62} | 61 | 59 | \textbf{62} | |
| 2017-Preiner-scholl-smt08 | 75 | 62 | 34 | \textbf{70} | 68 | |
| 2017-Preiner-tptp | 56 | 53 | \textbf{56} | \textbf{56} | \textbf{56} | |
| 2017-Preiner-ua | 137 | 136 | \textbf{137} | \textbf{137} | \textbf{137} | |
| 2018-Preiner-cav18 | 590 | 549 | \textbf{565} | \textbf{565} | 550 | |
| heizmann-ua | 110 | 11 | \textbf{109} | 104 | 17 | |
| wintersteiger | 94 | 85 | 89 | \textbf{92} | \textbf{92} | |
| UNSAT | Total UNSAT | 5049 | 4874 | 4970 | \textbf{4988} | 4905 |
| 2017-Preiner-keymaera | 108 | 103 | 77 | \textbf{104} | 108 | |
| 2017-Preiner-psyco | 132 | \textbf{131} | 129 | 123 | 132 | |
| 2017-Preiner-scholl-smt08 | 256 | 244 | 214 | \textbf{247} | 204 | |
| 2017-Preiner-tptp | 17 | 16 | \textbf{17} | \textbf{17} | \textbf{17} | |
| 2017-Preiner-ua | 16 | \textbf{16} | 14 | \textbf{16} | \textbf{16} | |
| heizmann-ua | 21 | 19 | 19 | \textbf{20} | 15 | |
| wintersteiger | 91 | 77 | 85 | \textbf{90} | 71 | |
| SAT | Total SAT | 641 | 606 | 555 | \textbf{617} | 563 |
| Total | 5751 | 5480 | 5525 | \textbf{5605} | 5468 |
4.3 Uniquely solved benchmarks
4.3.1 Only by Z3
z3Unique <- res %>%
    filter(z3.solved & !boolector.solved & !cvc4.solved & !q3b.solved) %>%
    select(family, benchmark) %>%
    group_by(family) %>%
    summarise(count = n()) %>%
    rename(Z3 = count)
| family | Z3 |
|---|---|
| 2017-Preiner-keymaera | 4 |
| 2017-Preiner-psyco | 1 |
| 2017-Preiner-scholl-smt08 | 1 |
| wintersteiger | 1 |
4.3.2 Only by Boolector
boolectorUnique <- res %>%
  filter(!z3.solved & boolector.solved & !cvc4.solved & !q3b.solved) %>%
  select(family, benchmark) %>%
  group_by(family) %>%
  summarise(count = n()) %>%
  rename(Boolector = count)
| family | Boolector |
|---|---|
| 2017-Preiner-keymaera | 1 |
| 2017-Preiner-scholl-smt08 | 5 |
| 2018-Preiner-cav18 | 1 |
4.3.3 Only by CVC4
cvc4Unique <- res %>%
  filter(!z3.solved & !boolector.solved & cvc4.solved & !q3b.solved) %>%
  select(family, benchmark) %>%
  group_by(family) %>%
  summarise(count = n()) %>%
  rename(CVC4 = count)
| family | CVC4 |
|---|---|
| 2017-Preiner-scholl-smt08 | 2 |
| heizmann-ua | 3 |
| wintersteiger | 1 |
4.3.4 Only by Q3B
q3bUnique <- res %>%
  filter(!z3.solved & !boolector.solved & !cvc4.solved & q3b.solved) %>%
  select(family, benchmark) %>%
  group_by(family) %>%
  summarise(count = n()) %>%
  rename(Q3B = count)
| family | Q3B |
|---|---|
| 2017-Preiner-keymaera | 1 |
| 2017-Preiner-scholl-smt08 | 10 |
| 2018-Preiner-cav18 | 11 |
| heizmann-ua | 1 |
| wintersteiger | 2 |
4.3.5 Merged table
uniqSolved <- Reduce(function(...) merge(..., all=TRUE), list(boolectorUnique, cvc4Unique, q3bUnique, z3Unique))
uniqSolved[is.na(uniqSolved)] <- 0
uniqSolved
| family | Boolector | CVC4 | Q3B | Z3 |
|---|---|---|---|---|
| 2017-Preiner-keymaera | 1 | 0 | 1 | 4 |
| 2017-Preiner-psyco | 0 | 0 | 0 | 1 |
| 2017-Preiner-scholl-smt08 | 5 | 2 | 10 | 1 |
| 2018-Preiner-cav18 | 1 | 0 | 11 | 0 |
| heizmann-ua | 0 | 3 | 1 | 0 |
| wintersteiger | 0 | 1 | 2 | 1 |
xt <- xtable(uniqSolved, type = "latex", label="tbl:uniquelySolved",digits=c(0,0,0,0,0,0),
  caption = "For each solver and benchmark family, the table shows the number of benchmarks solved only by the given solver.")
align(xt) <- c('l', 'l', 'r', 'r', 'r', 'r')
print(xt,
    file = "Tables/uniqueSolved.tex", include.rownames=FALSE, booktabs=TRUE, table.placement="tbp",
    sanitize.text.function=function(x) x,
    NA.string="0")
uniqSolvedSum <- uniqSolved %>%
                 summarize(Boolector = as.integer(sum(Boolector)),
                         CVC4 = as.integer(sum(CVC4)),
                         Q3B = as.integer(sum(Q3B)),
                         Z3 = as.integer(sum(Z3)))

uniqSolvedSum <- as.data.frame(t(uniqSolvedSum))
colnames(uniqSolvedSum) <- c("Uniquely solved")
uniqSolvedSum
| Uniquely solved | |
|---|---|
| Boolector | 7 |
| CVC4 | 6 |
| Q3B | 25 |
| Z3 | 7 |
4.3.6 By none of the solvers
res %>%
  filter(!z3.solved & !boolector.solved & !cvc4.solved & !q3b.solved) %>%
  select(family, benchmark) %>%
  group_by(family) %>%
  summarise(count = n())
| family | count |
|---|---|
| 2017-Preiner-keymaera | 2 |
| 2017-Preiner-scholl-smt08 | 43 |
| 2018-Preiner-cav18 | 10 |
| wintersteiger | 6 |
4.4 Cross comparison
4.4.1 Helper function to generate tables
First we need a function which for given configurations computes a number of benchmarks that the first configuration has solved, but the second one has not.
firstIsBetter <- function(c1, c2)
{
  c1Solved <- res[[paste(c1, 'solved', sep='.')]]
  c2Solved <- res[[paste(c2, 'solved', sep='.')]]

  onlyC1Solved <- c1Solved & !(c2Solved)
  return(onlyC1Solved)
}

formulasFirstIsBetter <- function(c1, c2)
{
  return(res[firstIsBetter(c1, c2)])
}

compareConfigurations <- function(c1, c2)
{
  return(sum(firstIsBetter(c1, c2)))
}
We can use this function to generate the cross table.
crossTable <- function()
{
  results <- c()
  for (c1 in configurations)
  {
    for (c2 in configurations)
    {
      results <- c(results, compareConfigurations(c1, c2))
    }
  }

  results.table <- matrix(results, ncol=4,byrow=TRUE)
  colnames(results.table) <- labels
  rownames(results.table) <- labels
  out <- as.data.frame(results.table)
  return(out)
}
4.4.2 Results
table <- crossTable()
table <- merge(table, uniqSolvedSum, by='row.names')
colnames(table) <- c("", "Boolector", "CVC4", "Q3B", "Z3", "Uniquely solved")
table
| Boolector | CVC4 | Q3B | Z3 | Uniquely solved | |
|---|---|---|---|---|---|
| Boolector | 0 | 118 | 68 | 72 | 7 |
| CVC4 | 163 | 0 | 61 | 173 | 6 |
| Q3B | 193 | 141 | 0 | 206 | 25 |
| Z3 | 60 | 116 | 69 | 0 | 7 |
xt <- xtable(table, type = "latex", label="tbl:cross",
             caption = "The table shows cross-comparison of solved benchmarks by all pairs of the solvers. Each cell shows the number of benchmarks that were solved by the solver in the corresponding row, but not by the solver by the corresponding column. The column \\emph{Uniquely solved} shows the number of benchmarks that were solved only by the given solver.")
align(xt) <- "llrrrr|r"
print(xt,
      file = "Tables/cross.tex", include.rownames=FALSE, booktabs=TRUE, table.placement="tbp")
5 Plots
5.1 Scatter plots
5.1.1 Helper functions
We again define a function, which can generate a scatter plot for a given benchmark set and two configurations.
      scatterPlot <- function(c1, c2)
      {
      return (ggplot(res,
            aes(res[[paste(c1, 'cputime', sep='.')]], res[[paste(c2, 'cputime', sep='.')]], colour=family), xlim=c(0.001,timeout), ylim=c(0.01,timeout)) +
            geom_point() +
            geom_abline(intercept=0) +
            geom_abline(intercept=1, color='gray') +
            geom_abline(intercept=-1, color='gray') +
            geom_abline(intercept=2, color='gray') +
            geom_abline(intercept=-2, color='gray') +
            xlab(labels[c1]) +
            ylab(labels[c2]) +
            scale_x_log10(limits = c(0.01, timeout), breaks = trans_breaks("log10", function(x) 10^x), labels = trans_format("log10", math_format(10^.x))) +
            scale_y_log10(limits = c(0.01, timeout), breaks = trans_breaks("log10", function(x) 10^x), labels = trans_format("log10", math_format(10^.x))) +
            guides(colour = guide_legend("Benchmark family")))
#           guides(colour=FALSE))
#           theme(legend.title=element_blank()))
      }

      scatterPlotMem <- function(c1, c2)
      {
      return (ggplot(res,
            aes(res[[paste(c1, 'memusage', sep='.')]], res[[paste(c2, 'memusage', sep='.')]], colour=factor(q3b.result, c("timeout", "sat", "unsat", "out of memory"))), xlim=c(0.001,8000000000), ylim=c(0.01,8000000000)) +
            geom_point() +
            geom_abline(intercept=0) +
            xlab(c1) +
            ylab(c2) +
            scale_x_log10(limits = c(1000000, 16000000000), breaks = trans_breaks("log10", function(x) 10^x), labels = trans_format("log10", math_format(10^.x))) +
            scale_y_log10(limits = c(1000000, 16000000000), breaks = trans_breaks("log10", function(x) 10^x), labels = trans_format("log10", math_format(10^.x))) +
            guides(colour=FALSE) +
            labels(colour = "Benchmark family") +
            theme(legend.title=element_blank()))

      }
5.1.2 Plots
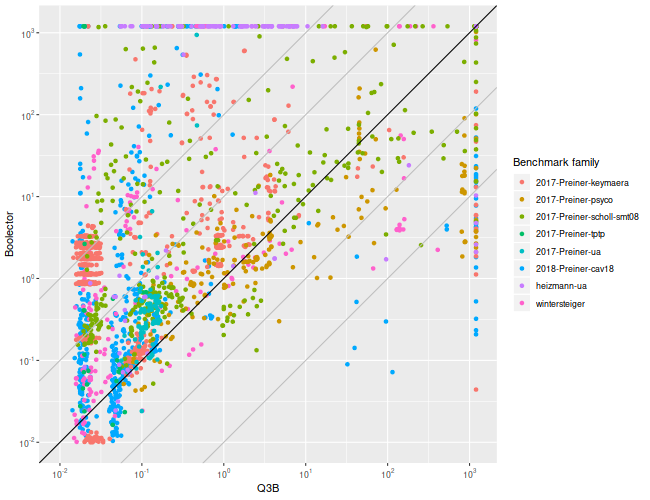
scatterPlot('q3b', 'boolector')
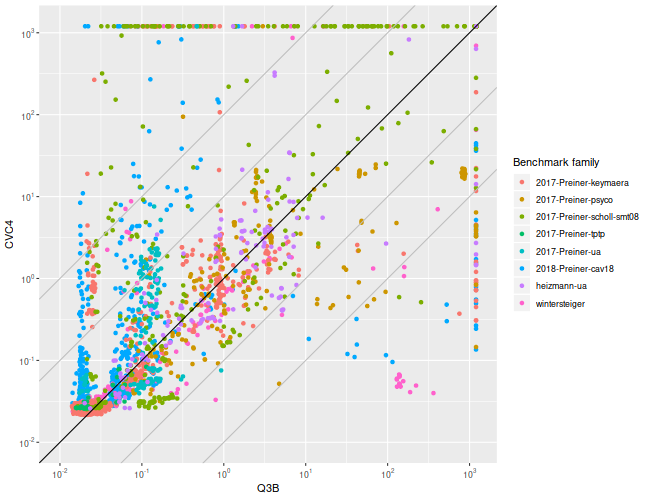
scatterPlot('q3b', 'cvc4')
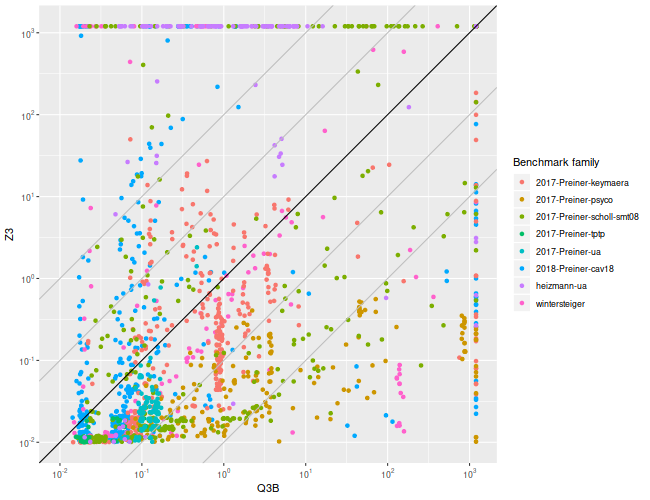
scatterPlot('q3b', 'z3')
5.2 Quantile plots
5.2.1 Helper functions
quantilePlot <- function(onlyTrivial = FALSE)
{
    num <- length(configurations)

    data <- res

    if (onlyTrivial)
    {
        data <- filter(data, trivial == FALSE)
    }

    ordered = list()
    for (c in configurations)
    {
        ordered[[c]] = sort(data[[paste(c, 'cputime', sep='.')]][data[[paste(c, 'solved', sep='.')]]])
    }

    plot(c(0, nrow(data)), c(0.001, timeout), log='y', xlab=if (onlyTrivial) 'Solved non-trivial formulas' else "Solved formulas", ylab='CPU time (s)', frame.plot=TRUE, type='n', yaxt="n")
    axis(2, at = c(0.001, 0.01, 0.1, 1, 10, 100, 1000),
         labels = c(expression(paste("10"^"-3")),
                    expression(paste("10"^"-2")),
                    expression(paste("10"^"-1")),
                    "1",
                    "10",
                    expression(paste("10"^"2")),
                    expression(paste("10"^"3"))))

    colors <- c("blue", "darkgreen", "red", "black", "purple", "goldenrod")
    ltys <- c(5,6,4,1,2,6)
    for (i in seq_along(configurations))
    {
        c <- configurations[i]
        lines(1:length(ordered[[c]]), ordered[[c]], type='s', col=colors[i], lty=ltys[i])
    }

    legend("topleft",
           lty=ltys,
           lwd=rep(2, each=num),
           col=colors,
           legend=labels)
}
5.2.2 Plot
configurations = c('boolector', 'cvc4', 'q3b', 'z3')
labels = c(boolector = 'Boolector', cvc4 = 'CVC4', q3b = 'Q3B', z3 = 'Z3')
quantilePlot()
pdf(file="Figures/all_quantile.pdf",width=8,height=4.5); tryCatch({
quantilePlot(FALSE)
},error=function(e){plot(x=-1:1, y=-1:1, type='n', xlab='', ylab='', axes=FALSE); text(x=0, y=0, labels=e$message, col='red'); paste('ERROR', e$message, sep=' : ')}); dev.off()
5.3 Quantile plots of non-trivial benchmarks
This plot shows only result that are not trivial (i.e. some solver took more than 0.1 second to solve it)
This is the number of trivial benchmarks
nrow(filter(res, trivial))
3225
quantilePlot(TRUE)
pdf(file="Figures/all_trivial_quantile.pdf",width=8,height=4.5); tryCatch({
quantilePlot(TRUE)
},error=function(e){plot(x=-1:1, y=-1:1, type='n', xlab='', ylab='', axes=FALSE); text(x=0, y=0, labels=e$message, col='red'); paste('ERROR', e$message, sep=' : ')}); dev.off()
5.4 Unsolved benchmarks
plotUnsolved <- function(cs)
{
    cs <- rev(cs)
    unsolved = data.frame(family=character(),
                          configuration=character(),
                          stringsAsFactors=TRUE)
    for (c in cs)
    {
        cUnsolved <- res[["family"]][!res[[paste(c, 'solved', sep='.')]]]
        cUnsolved <- data.frame(
            family = cUnsolved,
            configuration = labels[c])
        unsolved <- rbind(unsolved, cUnsolved)
    }

    print(levels(unsolved$family))
    unsolved$family<- factor(unsolved$family, levels=sort(levels(unsolved$family)))
    print(levels(unsolved$family))

    chart.data <- unsolved %>%
                    arrange(family) %>%
                    group_by(family, configuration) %>%
                    summarize(freq = n()) %>%
                    group_by(configuration) %>%
                    mutate(pos = cumsum(freq) - (0.5 * freq))

    ggplot(data = chart.data, aes(x = configuration, y = freq, fill = family)) +
        geom_bar(stat="identity", position=position_stack(reverse=TRUE)) +
        coord_flip() +
        geom_text(data=chart.data, aes(x = configuration, y = pos, label = ifelse(freq < 4, "", freq)), size=3) +
        labs(y = "Number of unsolved benchmarks (less is better)", x = NULL, fill = "Benchmark family") +
        scale_fill_brewer(palette = "Set2")
}
plotUnsolved(c('boolector', 'cvc4', 'q3b', 'z3'))
pdf(file="Figures/unsolved.pdf",width=9,height=5.5); tryCatch({
plotUnsolved(c('boolector', 'cvc4', 'q3b', 'z3'))
},error=function(e){plot(x=-1:1, y=-1:1, type='n', xlab='', ylab='', axes=FALSE); text(x=0, y=0, labels=e$message, col='red'); paste('ERROR', e$message, sep=' : ')}); dev.off()