Speeding-up Quantified Bit-Vector Solving by Reducing Bit-Width
Experimental evaluation
Table of Contents
1 CSV files
All statistics are computed from the BenchExec CSV file results.csv.
1.1 Convert to a correct CSV
First, we need to replace tabs by commas:
sed -i 's/\t/,/g' results.csv
And then we remove the standard BenchExec header rows and replace them by more readable ones. These are contained in the CSV file results_header.csv.
cat results_header.csv > results_out.csv
tail -n +4 results.csv >> results_out.csv
1.2 Split into benchmark sets
We split benchmark name into family and name.
sed -i 's#/#,##' results_out.csv
#separator is #, so we do not have to escape all backslashes
sed -i 's/UltimateAutomizer/ua/g' results_out.csv
2 R environment
2.1 Load necessary libraries
library(dplyr)
library(xtable)
library(ggplot2)
library(scales)
library(colorspace)
library(RColorBrewer)
options("scipen"=100, "digits"=2)
2.2 Load all CSV files
res <- read.csv("results_out.csv", header=TRUE, stringsAsFactors=FALSE)
configurations = c('boolector', 'boolectorRed', 'boolectorRedZero', 'cvc4', 'cvc4Red', 'q3b', 'q3bRed')
labels = c(boolector = 'Boolector', boolectorRed = 'Boolector+Red', boolectorRedZero = 'Boolector+RedZero', cvc4 = 'CVC4', cvc4Red = 'CVC4+Red', q3b = 'Q3B', q3bRed = 'Q3B+Red')
We need to modify all times for results other than sat or unsat to have the maximal values of walltime and CPU-time.
timeout <- 900

res[['trivial']] <- TRUE

for (c in configurations)
{
  res[[paste(c, 'solved', sep='.')]] <- res[[paste(c, 'result', sep='.')]] == "sat" | res[[paste(c, 'result', sep='.')]] == "unsat"
  res[[paste(c, 'cputime', sep='.')]][!res[[paste(c, 'solved', sep='.')]]] <- timeout
  res[[paste(c, 'walltime', sep='.')]][!res[[paste(c, 'solved', sep='.')]]] <- timeout
  res[['trivial']] <- res[['trivial']] & res[[paste(c, 'cputime', sep='.')]] < 0.1
}
2.3 Check correctness of results
We need to check that no two solvers disagreed on the status of a benchmark (i.e. sat vs unsat). The result of the following command should be empty!
res %>%
    mutate(sat = ((boolector.result == "sat") | (boolectorRed.result == "sat") | (boolectorRedZero.result == "sat") | (cvc4.result == "sat") | (cvc4Red.result == "sat")  | (q3b.result == "sat") | (q3bRed.result == "sat")),
           unsat = ((boolector.result == "unsat") | (boolectorRed.result == "unsat") | (boolectorRedZero.result == "unsat") | (cvc4.result == "unsat") | (cvc4Red.result == "unsat") | (q3b.result == "unsat") | (q3bRed.result == "unsat"))) %>%
    filter(sat & unsat) %>%
    select(benchmark, boolector.result, boolectorRed.result, cvc4.result, cvc4Red.result)
| benchmark | boolector.result | boolectorRed.result | cvc4.result | cvc4Red.result |
2.4 Compute virtual bests
configurations = c('boolector', 'boolectorRed', 'boolectorRedZero', 'cvc4', 'cvc4Red', 'boolectorCVC4', 'boolectorCVC4Red', 'q3b', 'q3bRed', 'boolectorQ3B', 'boolectorQ3BRed', 'boolectorCVC4Q3B', 'boolectorRedCVC4RedQ3BRed')
labels = c(boolector = 'btor', boolectorRed = 'btor-r', boolectorRedZero = 'btor-rz', cvc4 = 'cv4', cvc4Red = 'cvc4-r', boolectorCVC4 = 'btor | cvc4', boolectorCVC4Red = 'btor | cvc4-r', q3b = 'q3b', q3bRed = 'q3b-r', boolectorQ3B = 'btor | q3b', boolectorQ3BRed = 'btor | q3b-r', boolectorCVC4Q3B = 'btor | cvc4 | q3b', boolectorRedCVC4RedQ3BRed = 'btor-r | cvc4-r | q3b-r')
    res <- res %>% mutate(
      boolectorCVC4.solved = boolector.solved | cvc4.solved,
      boolectorCVC4.result = ifelse(boolector.solved, boolector.result, cvc4.result),
      boolectorCVC4.cputime = pmin(boolector.cputime, cvc4.cputime),
      boolectorCVC4.walltime = pmin(boolector.walltime, cvc4.walltime),
      boolectorCVC4.memusage = pmin(boolector.memusage, cvc4.memusage),
      boolectorCVC4Red.solved = boolector.solved | cvc4Red.solved,
      boolectorCVC4Red.result = ifelse(boolector.solved, boolector.result, cvc4Red.result),
      boolectorCVC4Red.cputime = pmin(boolector.cputime, cvc4Red.cputime),
      boolectorCVC4Red.walltime = pmin(boolector.walltime, cvc4Red.walltime),
      boolectorCVC4Red.memusage = pmin(boolector.memusage, cvc4Red.memusage),
      boolectorQ3B.solved = boolector.solved | q3b.solved,
      boolectorQ3B.result = ifelse(boolector.solved, boolector.result, q3b.result),
      boolectorQ3B.cputime = pmin(boolector.cputime, q3b.cputime),
      boolectorQ3B.walltime = pmin(boolector.walltime, q3b.walltime),
      boolectorQ3B.memusage = pmin(boolector.memusage, q3b.memusage),
      boolectorQ3BRed.solved = boolector.solved | q3bRed.solved,
      boolectorQ3BRed.result = ifelse(boolector.solved, boolector.result, q3bRed.result),
      boolectorQ3BRed.cputime = pmin(boolector.cputime, q3bRed.cputime),
      boolectorQ3BRed.walltime = pmin(boolector.walltime, q3bRed.walltime),
      boolectorQ3BRed.memusage = pmin(boolector.memusage, q3bRed.memusage),
      boolectorCVC4Q3B.solved = boolector.solved | cvc4.solved | q3b.solved,
      boolectorCVC4Q3B.result = ifelse(boolector.solved, boolector.result, ifelse(cvc4.solved, cvc4.result, q3b.result)),
      boolectorCVC4Q3B.cputime = pmin(boolector.cputime, cvc4.cputime, q3b.cputime),
      boolectorCVC4Q3B.walltime = pmin(boolector.walltime, cvc4.walltime, q3b.walltime),
      boolectorCVC4Q3B.memusage = pmin(boolector.memusage, cvc4.memusage, q3b.memusage),
      boolectorRedCVC4RedQ3BRed.solved = boolectorRed.solved | cvc4Red.solved | q3bRed.solved,
      boolectorRedCVC4RedQ3BRed.result = ifelse(boolectorRed.solved, boolectorRed.result, ifelse(cvc4Red.solved, cvc4Red.result, q3bRed.result)),
      boolectorRedCVC4RedQ3BRed.cputime = pmin(boolectorRed.cputime, cvc4Red.cputime, q3bRed.cputime),
      boolectorRedCVC4RedQ3BRed.walltime = pmin(boolectorRed.walltime, cvc4Red.walltime, q3bRed.walltime),
      boolectorRedCVC4RedQ3BRed.memusage = pmin(boolectorRed.memusage, cvc4Red.memusage, q3bRed.memusage)
)
3 Statistics
3.1 Numbers of solved formulas
3.1.1 Helper function to generate tables
getTable <- function()
{
  counts <- list()

  for (c in configurations)
  {
    counts[[c]] <- count_(res, paste(c, 'result', sep='.'))
    colnames(counts[[c]]) <- c('result', c)
  }

  return(Reduce(function(...) merge(..., all=TRUE), counts))
}
3.1.2 Table
getTable()
| result | boolector | boolectorRed | boolectorRedZero | cvc4 | cvc4Red | boolectorCVC4 | boolectorCVC4Red | q3b | q3bRed | boolectorQ3B | boolectorQ3BRed | boolectorCVC4Q3B | boolectorRedCVC4RedQ3BRed |
|---|---|---|---|---|---|---|---|---|---|---|---|---|---|
| OUT OF MEMORY | nil | nil | nil | nil | nil | nil | nil | nil | 1 | nil | nil | nil | nil |
| sat | 597 | 605 | 604 | 551 | 594 | 614 | 620 | 598 | 604 | 633 | 633 | 635 | 637 |
| TIMEOUT (timeout) | 288 | 264 | 270 | 237 | 156 | 121 | 112 | 166 | 154 | 84 | 84 | 73 | 69 |
| unsat | 4866 | 4882 | 4877 | 4963 | 5001 | 5016 | 5019 | 4987 | 4992 | 5034 | 5034 | 5043 | 5045 |
3.2 Solved formulas in benchmark families
table <- res %>%
  group_by(family) %>%
  summarise(total = n(),
            boolector = sum(boolector.solved),
            boolectorRed = sum(boolectorRed.solved),
            boolectorRedZero = sum(boolectorRedZero.solved),
            cvc4 = sum(cvc4.solved),
            cvc4Red = sum(cvc4Red.solved),
            boolectorCVC4 = sum(boolectorCVC4.solved),
            boolectorCVC4Red = sum(boolectorCVC4Red.solved),
            q3b = sum(q3b.solved),
            q3bRed = sum(q3bRed.solved),
            boolectorQ3B = sum(boolectorQ3B.solved),
            boolectorQ3BRed = sum(boolectorQ3BRed.solved),
            boolectorCVC4Q3B = sum(boolectorCVC4Q3B.solved),
            boolectorRedCVC4RedQ3BRed = sum(boolectorRedCVC4RedQ3BRed.solved)
            )

table <- rbind(table, data.frame(family='Total',
  total = sum(table$total),
  boolector = sum(table$boolector),
  boolectorRed = sum(table$boolectorRed),
  boolectorRedZero = sum(table$boolectorRedZero),
  cvc4 = sum(table$cvc4),
  cvc4Red = sum(table$cvc4Red),
  boolectorCVC4 = sum(table$boolectorCVC4),
  boolectorCVC4Red = sum(table$boolectorCVC4Red),
  q3b = sum(table$q3b),
  q3bRed = sum(table$q3bRed),
  boolectorQ3B = sum(table$boolectorQ3B),
  boolectorQ3BRed = sum(table$boolectorQ3BRed),
  boolectorCVC4Q3B = sum(table$boolectorCVC4Q3B),
  boolectorRedCVC4RedQ3BRed = sum(table$boolectorRedCVC4RedQ3BRed))
  )
table
| family | total | boolector | boolectorRed | boolectorRedZero | cvc4 | cvc4Red | boolectorCVC4 | boolectorCVC4Red | q3b | q3bRed | boolectorQ3B | boolectorQ3BRed | boolectorCVC4Q3B | boolectorRedCVC4RedQ3BRed |
|---|---|---|---|---|---|---|---|---|---|---|---|---|---|---|
| 2017-Preiner-keymaera | 4035 | 4017 | 4023 | 4024 | 3996 | 4028 | 4023 | 4028 | 4009 | 4010 | 4025 | 4025 | 4029 | 4031 |
| 2017-Preiner-psyco | 194 | 191 | 191 | 191 | 190 | 190 | 193 | 193 | 165 | 167 | 192 | 192 | 193 | 193 |
| 2017-Preiner-scholl-smt08 | 374 | 296 | 303 | 301 | 244 | 275 | 306 | 309 | 314 | 319 | 324 | 324 | 326 | 328 |
| 2017-Preiner-tptp | 73 | 69 | 72 | 69 | 73 | 73 | 73 | 73 | 73 | 73 | 73 | 73 | 73 | 73 |
| 2017-Preiner-ua | 153 | 151 | 152 | 152 | 151 | 153 | 152 | 153 | 153 | 153 | 153 | 153 | 153 | 153 |
| 20170501-Heizmann-ua | 131 | 30 | 31 | 30 | 125 | 127 | 130 | 130 | 124 | 125 | 128 | 128 | 131 | 131 |
| 2018-Preiner-cav18 | 600 | 548 | 554 | 553 | 563 | 577 | 577 | 577 | 565 | 567 | 590 | 590 | 590 | 590 |
| wintersteiger | 191 | 161 | 161 | 161 | 172 | 172 | 176 | 176 | 182 | 182 | 182 | 182 | 183 | 183 |
| Total | 5751 | 5463 | 5487 | 5481 | 5514 | 5595 | 5630 | 5639 | 5585 | 5596 | 5667 | 5667 | 5678 | 5682 |
Generate LaTeX tables for the paper.
boolectorTable = table %>% select(family, total, boolector, boolectorRed, boolectorRedZero)
colnames(boolectorTable) <- c("Family", "Total", "\\texttt{btor}", "\\texttt{btor-r}", "\\texttt{btor-rz}")
print(xtable(boolectorTable,
  type = "latex",
  label = "tbl:red:solvedBoolector",
  caption = "Comparison of benchmarks solved by \texttt{btor}, \texttt{btor-r}, and \texttt{btor-rz} within the given timeout."),
  file = "solvedBoolector.tex",
  sanitize.colnames.function = function(x) x, include.rownames=FALSE, booktabs=TRUE, hline.after = c(-1, 0, nrow(table)-1, nrow(table)))
otherTable = table %>% select(family, total, boolectorCVC4, boolectorCVC4Red, boolectorQ3B, boolectorQ3BRed)
colnames(otherTable) <- c("Family", "Total", "\\texttt{btor|cvc4}", "\\texttt{btor|cvc4-r}", "\\texttt{btor|q3b}", "\\texttt{btor|q3b-r}")
print(xtable(otherTable,
  type = "latex",
  label = "tbl:red:solvedOther",
  caption = "Comparison of benchmarks solved by \texttt{btor|cvc4}, \texttt{btor|cvc4-r}, \texttt{btor|q3b}, and \texttt{btor|q3b-r} within the given timeout."),
  file = "solvedOther.tex",
  sanitize.colnames.function = function(x) x, include.rownames=FALSE, booktabs=TRUE, rotate.colnames=TRUE, hline.after = c(-1, 0, nrow(table)-1, nrow(table)))
otherTable = table %>% select(family, total, boolectorCVC4Q3B, boolectorRedCVC4RedQ3BRed)
colnames(otherTable) <- c("Family", "Total", "\\texttt{btor|cvc4|q3b}", "\\texttt{btor-r|cvc4-r|q3b-r}")
print(xtable(otherTable,
  type = "latex",
  label = "tbl:red:solvedAll",
  caption = "Comparison of benchmarks solved by \texttt{btor|cvc4|q3b} and \texttt{btor-r|cvc4-r|q3b-r} within the given timeout."),
  file = "solvedAll.tex",
  sanitize.colnames.function = function(x) x, include.rownames=FALSE, booktabs=TRUE, rotate.colnames=TRUE, hline.after = c(-1, 0, nrow(table)-1, nrow(table)))
3.3 Cross comparison
3.3.1 Helper function to generate tables
First we need a function which for given configurations computes a number of benchmarks that the first configuration has solved, but the second one has not.
firstIsBetter <- function(c1, c2)
  {
    c1Solved <- res[[paste(c1, 'solved', sep='.')]]
    c2Solved <- res[[paste(c2, 'solved', sep='.')]]

    onlyC1Solved <- c1Solved & !(c2Solved)
    return(onlyC1Solved)
  }

  formulasFirstIsBetter <- function(c1, c2)
  {
    return(res$benchmark[firstIsBetter(c1, c2)])
  }

  compareConfigurations <- function(c1, c2)
  {
    return(sum(firstIsBetter(c1, c2)))
  }
We can use this function to generate the cross table.
crossTable <- function()
{
  results <- c()
  for (c1 in configurations)
  {
    for (c2 in configurations)
    {
      results <- c(results, compareConfigurations(c1, c2))
    }
  }

  results.table <- matrix(results, ncol=13,byrow=TRUE)
  colnames(results.table) <- configurations
  rownames(results.table) <- configurations
  out <- as.table(results.table)
  return(out)
}
3.3.2 Table
crossTable()
| boolector | boolectorRed | boolectorRedZero | cvc4 | cvc4Red | boolectorCVC4 | boolectorCVC4Red | q3b | q3bRed | boolectorQ3B | boolectorQ3BRed | boolectorCVC4Q3B | boolectorRedCVC4RedQ3BRed | |
|---|---|---|---|---|---|---|---|---|---|---|---|---|---|
| boolector | 0 | 0 | 0 | 116 | 44 | 0 | 0 | 82 | 71 | 0 | 0 | 0 | 0 |
| boolectorRed | 24 | 0 | 9 | 128 | 48 | 12 | 4 | 88 | 77 | 6 | 6 | 4 | 0 |
| boolectorRedZero | 18 | 3 | 0 | 128 | 48 | 12 | 4 | 87 | 76 | 5 | 5 | 4 | 1 |
| cvc4 | 167 | 155 | 161 | 0 | 0 | 0 | 0 | 76 | 70 | 11 | 11 | 0 | 0 |
| cvc4Red | 176 | 156 | 162 | 81 | 0 | 9 | 0 | 89 | 79 | 13 | 13 | 2 | 0 |
| boolectorCVC4 | 167 | 155 | 161 | 116 | 44 | 0 | 0 | 93 | 82 | 11 | 11 | 0 | 0 |
| boolectorCVC4Red | 176 | 156 | 162 | 125 | 44 | 9 | 0 | 95 | 84 | 13 | 13 | 2 | 0 |
| q3b | 204 | 186 | 191 | 147 | 79 | 48 | 41 | 0 | 0 | 0 | 0 | 0 | 0 |
| q3bRed | 204 | 186 | 191 | 152 | 80 | 48 | 41 | 11 | 0 | 0 | 0 | 0 | 0 |
| boolectorQ3B | 204 | 186 | 191 | 164 | 85 | 48 | 41 | 82 | 71 | 0 | 0 | 0 | 0 |
| boolectorQ3BRed | 204 | 186 | 191 | 164 | 85 | 48 | 41 | 82 | 71 | 0 | 0 | 0 | 0 |
| boolectorCVC4Q3B | 215 | 195 | 201 | 164 | 85 | 48 | 41 | 93 | 82 | 11 | 11 | 0 | 0 |
| boolectorRedCVC4RedQ3BRed | 219 | 195 | 202 | 168 | 87 | 52 | 43 | 97 | 86 | 15 | 15 | 4 | 0 |
3.4 Times
table <- res %>%
  group_by(family) %>%
  summarise(boolector = round(sum(boolector.walltime)),
            boolectorRed = round(sum(boolectorRed.walltime)),
            cvc4 = round(sum(cvc4.walltime)),
            cvc4Red = round(sum(cvc4Red.walltime)),
            boolectorCVC4 = round(sum(boolectorCVC4.walltime)),
            boolectorCVC4Red = round(sum(boolectorCVC4Red.walltime)),
            q3b = round(sum(q3b.walltime)),
            q3bRed = round(sum(q3bRed.walltime)),
            boolectorQ3B = round(sum(boolectorQ3B.walltime)),
            boolectorQ3BRed = round(sum(boolectorQ3BRed.walltime))
            )

table <- rbind(table, data.frame(family='Total',
  boolector = sum(table$boolector),
  boolectorRed = sum(table$boolectorRed),
  cvc4 = sum(table$cvc4),
  cvc4Red = sum(table$cvc4Red),
  boolectorCVC4 = sum(table$boolectorCVC4),
  boolectorCVC4Red = sum(table$boolectorCVC4Red),
  q3b = sum(table$q3b),
  q3bRed = sum(table$q3bRed),
  boolectorQ3B = sum(table$boolectorQ3B),
  boolectorQ3BRed = sum(table$boolectorQ3BRed)))
table
| family | boolector | boolectorRed | cvc4 | cvc4Red | boolectorCVC4 | boolectorCVC4Red | q3b | q3bRed | boolectorQ3B | boolectorQ3BRed |
|---|---|---|---|---|---|---|---|---|---|---|
| 2017-Preiner-keymaera | 21484 | 14076 | 36214 | 9749 | 12974 | 8216 | 24193 | 23514 | 9446 | 9547 |
| 2017-Preiner-psyco | 3573 | 3652 | 4666 | 4683 | 1402 | 1408 | 26819 | 25495 | 2444 | 2431 |
| 2017-Preiner-scholl-smt08 | 74613 | 67834 | 119691 | 91839 | 65750 | 62517 | 56453 | 51729 | 47048 | 46635 |
| 2017-Preiner-tptp | 3604 | 907 | 2 | 8 | 2 | 3 | 2 | 7 | 1 | 3 |
| 2017-Preiner-ua | 1976 | 1344 | 1884 | 337 | 963 | 130 | 11 | 22 | 8 | 13 |
| 20170501-Heizmann-ua | 91204 | 90292 | 6028 | 4228 | 1231 | 1239 | 6482 | 5576 | 2811 | 2807 |
| 2018-Preiner-cav18 | 49054 | 43152 | 34711 | 22073 | 21789 | 21507 | 32014 | 30158 | 9235 | 9256 |
| wintersteiger | 27479 | 27363 | 17241 | 17241 | 13786 | 13784 | 9390 | 9355 | 8607 | 8573 |
| Total | 272987 | 248620 | 220437 | 150158 | 117897 | 108804 | 155364 | 145856 | 79600 | 79265 |
print(xtable(tableWall, type = "latex",
caption = "The table shows for each benchmark family and both of the solvers the sum of wall times of benchmarks that were solved by both of the solvers."),
file = "times_wall.tex", include.rownames=FALSE, booktabs=TRUE, hline.after = c(-1, 0, nrow(tableWall)-1, nrow(tableWall)))
4 Plots
4.1 Scatter plots
4.1.1 Helper functions
We again define a function, which can generate a scatter plot for a given benchmark set and two configurations.
scatterPlotResult <- function(c1, c2, time = 'cputime')
{
return (ggplot(res,
      aes(res[[paste(c1, time, sep='.')]], res[[paste(c2, time, sep='.')]], shape=boolectorCVC4Red.result, colour=family), xlim=c(0.001,2*timeout), ylim=c(0.001,2*timeout)) +
      geom_point() +
      scale_shape_manual(values=c(4, 5, 6)) +
      geom_abline(intercept=0) +
      geom_abline(intercept=1, color='gray') +
      geom_abline(intercept=-1, color='gray') +
      geom_abline(intercept=2, color='gray') +
      geom_abline(intercept=-2, color='gray') +
      labs(title = "", x = labels[c1], y = labels[c2], color = "Family", shape = "Result") +
      scale_x_log10(limits = c(0.005, 2*timeout), breaks = trans_breaks("log10", function(x) 10^x), labels = trans_format("log10", math_format(10^.x))) +
      scale_y_log10(limits = c(0.005, 2*timeout), breaks = trans_breaks("log10", function(x) 10^x), labels = trans_format("log10", math_format(10^.x))))
}

scatterPlotMem <- function(c1, c2)
{
return (ggplot(res,
      aes(res[[paste(c1, 'memusage', sep='.')]], res[[paste(c2, 'memusage', sep='.')]], colour=factor(boolectorCVC4Red.result, c("timeout", "sat", "unsat", "out of memory"))), xlim=c(0.001,8000000000), ylim=c(0.01,8000000000)) +
      geom_point() +
      geom_abline(intercept=0) +
      xlab(c1) +
      ylab(c2) +
      scale_x_log10(limits = c(1000000, 16000000000), breaks = trans_breaks("log10", function(x) 10^x), labels = trans_format("log10", math_format(10^.x))) +
      scale_y_log10(limits = c(1000000, 16000000000), breaks = trans_breaks("log10", function(x) 10^x), labels = trans_format("log10", math_format(10^.x))) +
      guides(colour=FALSE))
}
4.1.2 Wall Time
scatterPlotResult('boolector', 'boolectorRed', 'walltime')
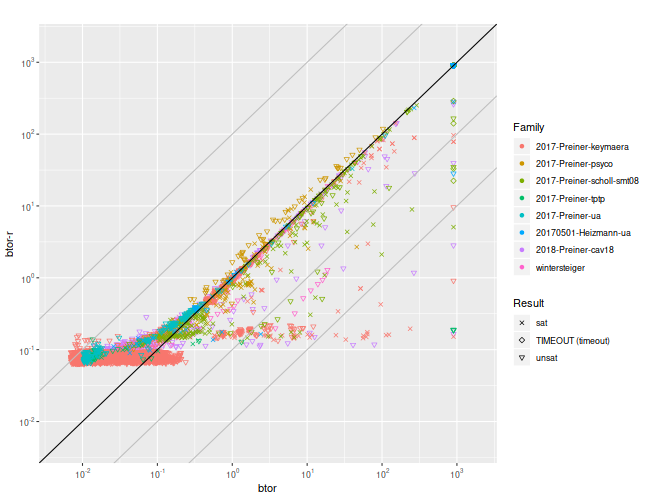
scatterPlotResult('boolector', 'boolectorRed', 'walltime')
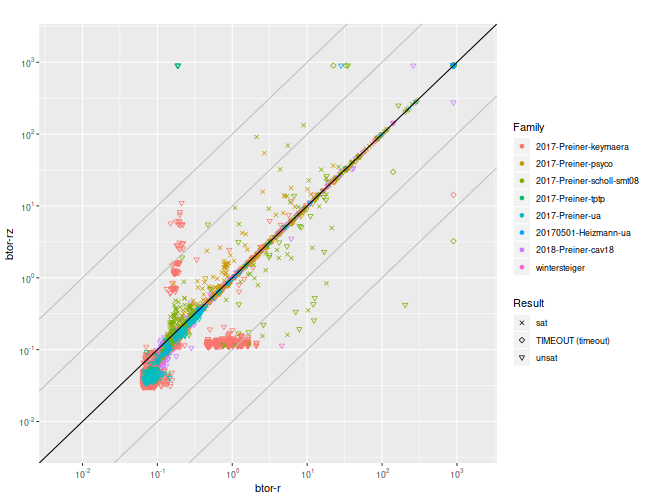
scatterPlotResult('boolectorRed', 'boolectorRedZero', 'walltime')
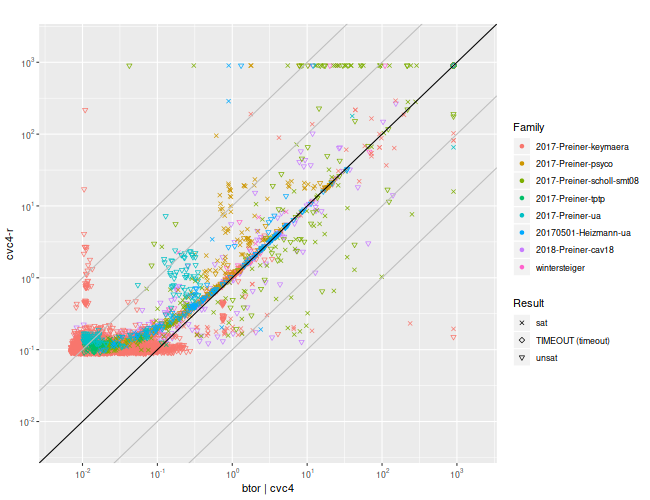
scatterPlotResult('boolectorCVC4', 'cvc4Red', 'walltime')
scatterPlotResult('boolectorCVC4', 'boolectorCVC4Red', 'walltime')
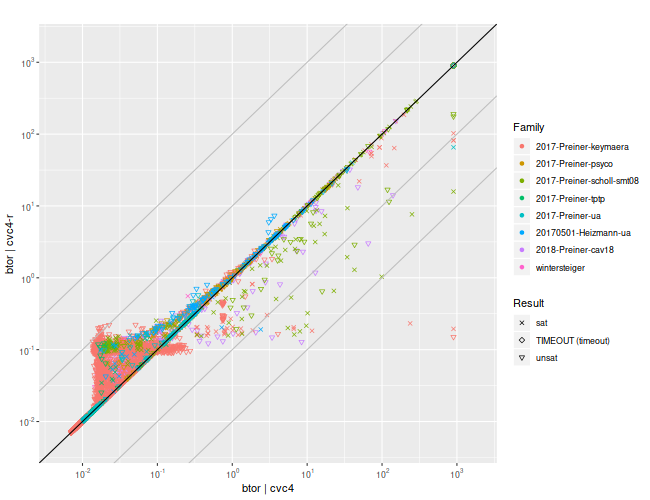
scatterPlotResult('boolectorCVC4', 'boolectorCVC4Red', 'walltime')
scatterPlotResult('boolectorQ3B', 'boolectorQ3BRed', 'walltime')
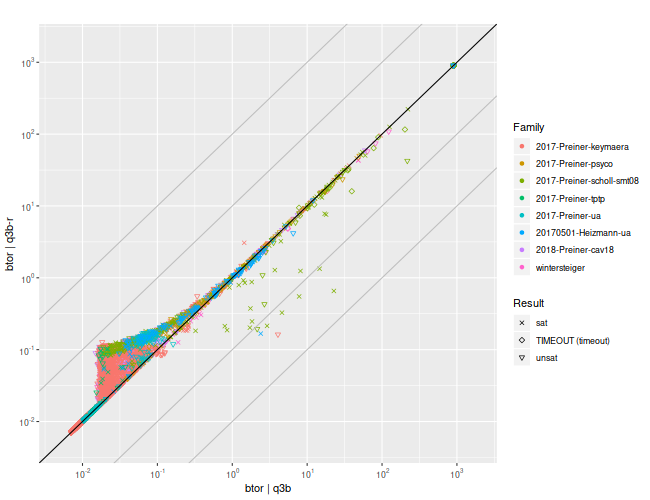
scatterPlotResult('boolectorQ3B', 'boolectorQ3BRed', 'walltime')
scatterPlotResult('boolectorCVC4Q3B', 'boolectorRedCVC4RedQ3BRed', 'walltime')
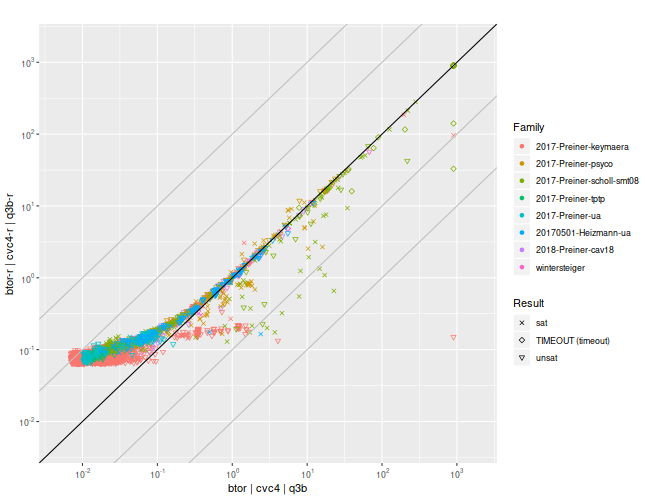
scatterPlotResult('boolectorCVC4Q3B', 'boolectorRedCVC4RedQ3BRed', 'walltime')
5 Bit-widths
For the formulas that were solved faster by the reducing solver, we check which reduced bit-width was necessary to solve them.
Unzip the results from BenchExec.
cd bitwidths
unzip benchmark-formulaReducer-all.2019-04-06_1523.logfiles.zip
Remove all results that were decided by the precise solver.
grep -rl "Child Process 0" bitwidths | xargs rm
Get the bit-widths of remaining benchmarks.
for f in bitwidths/benchmark-formulaReducer-all.2019-04-06_1523.logfiles/* ; do grep "Reducing to" $f | tail -1 | cut -d' ' -f3; done > bitwidths/bitwidths.log
wc -l bitwidths/bitwidths.log
558 bitwidths/bitwidths.log
Finally, load the results into R and divide them by the bit-width.
df <- read.table("bitwidths/bitwidths.log", header = FALSE)
names(df) <- 'bitwidth'
t(count(df, bitwidth))
| bitwidth | 1 | 2 | 4 | 8 | 16 | 32 | 64 |
| n | 122 | 286 | 97 | 24 | 4 | 24 | 1 |