Error: I'm afraid this is the first I've heard of a "txt" flavoured Blosxom. Try dropping the "/+txt" bit from the end of the URL.
Packet Loss
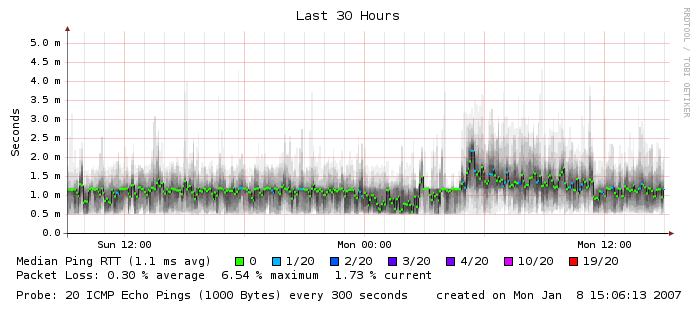
During the last few days we have experienced spikes of unusually high packet
loss on one of our networks. This finally made me to install SmokePing, a network latency
and packet loss measurement tool by Tobi Oetiker (author of
MRTG and
rrdtool, another two excellent Open source
network monitoring tools).
(click for a bigger image) I can recommend SmokePing - it is easy to configure and does what I want.
On the packet loss front: I still do not know the exact cause. One of the problems was that we were under huge network scan few days ago, so maybe the IP blacklist got too big. The other problem definitely is that this network is connected to the router by a 100baseTX interface only, while the switch of that network as well as the server NICs have gigabit speed. But I thought all buffers along the path should be big enough for TCP to adapt to the available bandwidth. Linux has 1000 packets queue for a 100Mbit interface, and 5000 packets for a gigabit one. The switch (HP 2824) says the following about the memory:
Packet   - Total   : 1998
Buffers    Free    : 1607
           Lowest  : 1590
           Missed  : 0
which I interpret as "no packet lost because of the memory shortage". However, the uplink interface definitely shows something strange:
Status and Counters - Port Counters for port 23

Name  :

Link Status     : Up

Bytes Rx        : 4,173,035,216       Bytes Tx        : 290,829,123
Unicast Rx      : 1,193,775,726       Unicast Tx      : 1,030,811,282
Bcast/Mcast Rx  : 421,349             Bcast/Mcast Tx  : 12,537,341

FCS Rx          : 0                   Drops Rx        : 4,386,042
Alignment Rx    : 0                   Collisions Tx   : 0
Runts Rx        : 0                   Late Colln Tx   : 0
Giants Rx       : 0                   Excessive Colln : 0
Total Rx Errors : 0                   Deferred Tx     : 0
The interesting part is the Drops Rx value. The value there
is too big (and far biggest of all ports), but why it is not included
in Total Rx Errors? The manual apparently does not say
anything about exact meaning of these counters. Is my lazyweb more
informed? #